DOT Price (Polkadot) Approaches Key Level: Should Traders Brace for Sharp Drop?
Polkadot (DOT) is showing bearish signs below the $8 resistance against the US Dollar. The price could extend its decline if it fails to stay above $6.00. DOT is gaining pace below the $8.80 and $8.00 levels against the...

Polkadot (DOT) is showing bearish signs below the $8 resistance against the US Dollar. The price could extend its decline if it fails to stay above $6.00.
- DOT is gaining pace below the $8.80 and $8.00 levels against the US Dollar.
- The price is trading below the $7.20 zone and the 100 simple moving average (4 hours).
- There is a key bearish trend line forming with resistance at $6.50 on the 4-hour chart of the DOT/USD pair (data source from Kraken).
- The pair could continue to decline toward the $5.00 support zone.
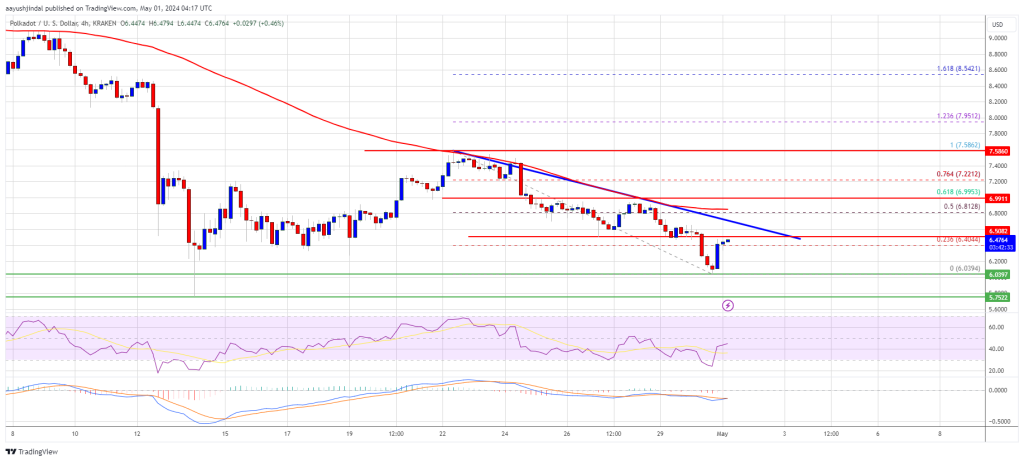
After a steady increase, DOT price faced resistance near the $7.60 zone. It formed a short-term top and started a fresh decline below the $7.00 level, like Ethereum and Bitcoin.
There was a move below the $6.20 support zone. A low was formed near $6.03 and the price is now consolidating losses. It is slowly moving higher above the $6.35 level and the 23.6% Fib retracement level of the downward move from the $7.58 swing high to the $6.03 low.
DOT is now trading below the $7.00 zone and the 100 simple moving average (4 hours). Immediate resistance is near the $6.50 level. There is also a key bearish trend line forming with resistance at $6.50 on the 4-hour chart of the DOT/USD pair.
Source: DOTUSD on TradingView.com
The next major resistance is near $7.00 or the 61.8% Fib retracement level of the downward move from the $7.58 swing high to the $6.03 low. A successful break above $7.00 could start another strong rally. In the stated case, the price could easily rally toward $8.20 in the near term. The next major resistance is seen near the $10.00 zone.
More Downsides in DOT?If DOT price fails to start a fresh increase above $7.00, it could continue to move down. The first key support is near the $6.00 level.
The next major support is near the $5.65 level, below which the price might decline to $5.00. Any more losses may perhaps open the doors for a move toward the $4.20 support zone or the trend line.
Technical Indicators
4-Hours MACD – The MACD for DOT/USD is now losing momentum in the bearish zone.
4-Hours RSI (Relative Strength Index) – The RSI for DOT/USD is now below the 50 level.
Major Support Levels – $6.00, $5.65 and $5.00.
Major Resistance Levels – $6.50, $7.00, and $8.50.
Original source
Read on NewsBTCRelated market context

Bitcoin Stabilizes Near Key Zone, But Glassnode Warns Capital Flows Remain Weak
Bitcoin’s rebound from the $60,000 area has given bulls something to work with, but Glassnode’s latest market read suggests the re...

BTC News Today: Bitcoin Climbs Toward $66K as Trump Reveals US-Iran Peace Deal
The renewed geopolitical optimism helped improve risk sentiment across financial markets, pushing Bitcoin back toward the $66,000...

Bitcoin Price Prediction: Bank of Japan Rate Hike and Piling Yen Shorts Threaten BTC
Bitcoin price is back above $65,000, gaining more than $3,000 in a day, although Washington helps, news from the other side of the...

XRP Price Prediction: US-Iran Peace Deal Fuels 13% XRP Surge, Analysts Target $1.94 Retest
The latest move saw XRP price today reclaim the $1.28 level for the first time in nearly two weeks. Market participants pointed to...

Ethereum Price Prediction: ETH is Still Below Its 200 Week SMA, and Tom Lee Buying Spree Might End Soon
Ethereum price is trading above $1,700 after running for 5% today, and even our prediction model is calling for more leg higher. H...

Bitcoin Price and Crypto Stocks Surge as Iran Ceasefire, Strategy’s $100M Buy Collide With Fed Week
Bitcoin Magazine Bitcoin Price and Crypto Stocks Surge as Iran Ceasefire, Strategy’s $100M Buy Collide With Fed Week Bitcoin price...