DOT Price (Polkadot) Hints At Potential Recovery, Here’s What Could Propel It To $4.8
Polkadot’s DOT is recovering higher from the $3.92 support against the US Dollar. The price could gain pace if it clears the $4.20 and $4.35 resistance levels. DOT is slowly moving higher above the $4.05 resistance zone...

Polkadot’s DOT is recovering higher from the $3.92 support against the US Dollar. The price could gain pace if it clears the $4.20 and $4.35 resistance levels.
- DOT is slowly moving higher above the $4.05 resistance zone against the US Dollar.
- The price is trading just above the $4.15 zone and the 100 simple moving average (4 hours).
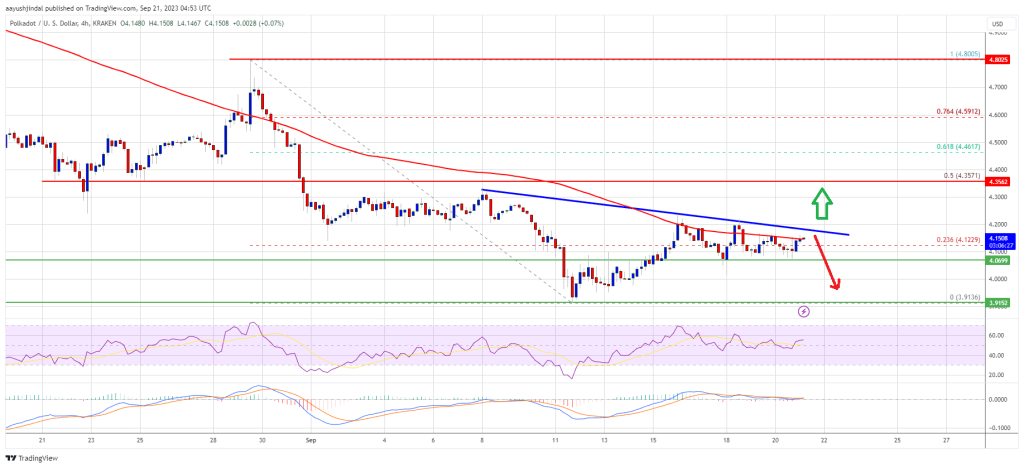
- There is a key bearish trend line forming with resistance near $4.175 on the 4-hour chart of the DOT/USD pair (data source from Kraken).
- The pair could gain bullish momentum if there is a close above $4.20 and $4.35.
After a sharp decline, DOT price found support near the $3.90 zone. A low is formed near $3.91 and the price is now attempting a fresh increase, like Bitcoin and Ethereum.
There was a break above the $4.00 and $4.05 resistance levels. The price surpassed the 23.6% Fib retracement level of the downward move from the $4.80 swing high to the $3.91 low. DOT is now trading just above the $4.15 zone and the 100 simple moving average (4 hours).
Immediate resistance is near the $4.20 level. There is also a key bearish trend line forming with resistance near $4.175 on the 4-hour chart of the DOT/USD pair.
Source: DOTUSD on TradingView.com
The next major resistance is near $4.35. It is near the 50% Fib retracement level of the downward move from the $4.80 swing high to the $3.91 low. A successful break above $4.35 could start a strong rally. In the stated case, the price could easily rally toward $4.80 in the coming days. The next major resistance is seen near the $5.0 zone.
Another Decline?If DOT price fails to continue higher above $4.20 or $4.35, it could start another decline. The first key support is near the $4.05 level.
The next major support is near the $3.90 level and the last low, below which the price might decline to $3.75. Any more losses may perhaps open the doors for a move toward the $3.50 support zone.
Technical Indicators
4-Hours MACD – The MACD for DOT/USD is now gaining momentum in the bullish zone.
4-Hours RSI (Relative Strength Index) – The RSI for DOT/USD is now above the 50 level.
Major Support Levels – $4.05, $3.90 and $3.75.
Major Resistance Levels – $4.20, $4.35, and $4.80.
Original source
Read on NewsBTCRelated market context

Standard Chartered Says Bitcoin Bottomed Near $59,000 As Crypto Winter Ends
TL;DR Standard Chartered’s Geoffrey Kendrick reportedly says Bitcoin’s $59,000 area marked the cycle bottom. The note cites SpaceX...

Tether USDT Briefly Overtakes Ethereum in Market Cap: A $187B Wake-Up Call
For a few hours, earlier this week, Tether USDT stablecoin held a higher market cap than Ethereum, the first time that has happene...

Bitcoin price challenges $64,000 weekend wall – needing a breakout or risk a deeper correction
Bitcoin reclaimed $64,000 on June 12 and touched an intraday high of $64,301 in the same session that spot ETF flows finally flipp...

Bitcoin rises above $64,000 after Pakistan prime minister says Iran peace deal is near
Bitcoin traded above $64,000 on Saturday, supported by its strongest ETF inflows in a month and growing optimism around geopolitic...

Bitcoin price faces new risk as big buyers lose conviction
Bitcoin’s largest buyers are no longer behaving like a reliable backstop for the largest cryptocurrency. The exchange-traded funds...

Google Gemini AI Predicts Jaw-Dropping XRP Price For Next 90 Days
Google Gemini AI just put XRP back under the spotlight, predicting it is tightly wound for a major breakout toward $1.60 to $1.80...