DOT Price (Polkadot) Holds Strong At $6.6, Signs Point To Fresh Rally Ahead
Polkadot (DOT) is correcting gains from the $7.75 against the US Dollar. The price could start a fresh increase unless there is a close below $6.30. DOT is consolidating gains above the $6.60 support zone against the US...

Polkadot (DOT) is correcting gains from the $7.75 against the US Dollar. The price could start a fresh increase unless there is a close below $6.30.
- DOT is consolidating gains above the $6.60 support zone against the US Dollar.
- The price is trading above the $6.65 zone and the 100 simple moving average (4 hours).
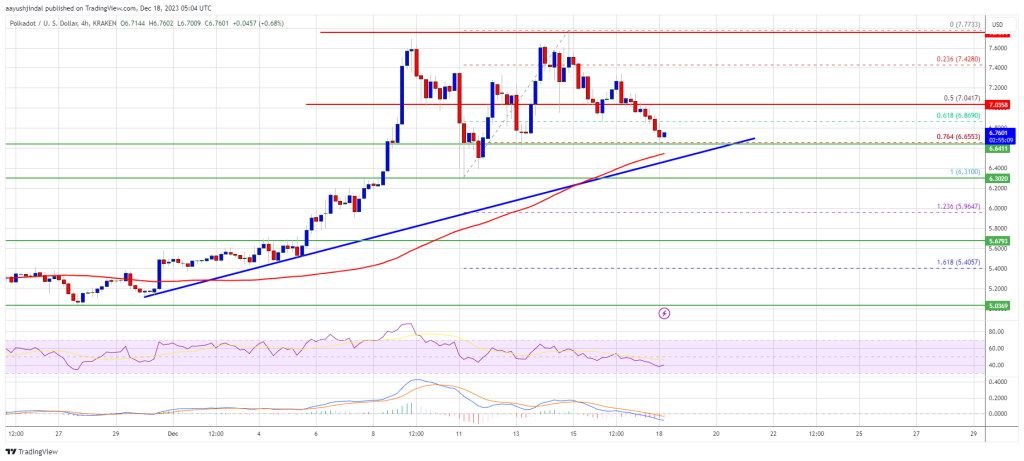
- There is a key bullish trend line forming with support near $6.65 on the 4-hour chart of the DOT/USD pair (data source from Kraken).
- The pair could start a fresh increase if the bulls protect the $6.65 and $6.30 support levels.
After forming a base above the $5.50 support, DOT price started a decent increase. The price was able to clear the $5.85 and $6.00 resistance levels to move into a positive zone, like Bitcoin and Ethereum.
Polkadot even surpassed the $6.65 resistance zone and settled above the 100 simple moving average (4 hours). Finally, the bears appeared near the $7.75 zone. A high was formed near $7.77 and the price is now correcting gains. There was a drop below the $7.20 and $7.00 levels.
DOT declined below the 61.8% Fib retracement level of the upward move from the $6.31 swing low to the $7.77 high. However, it is still above the $6.65 zone and the 100 simple moving average (4 hours).
There is also a key bullish trend line forming with support near $6.65 on the 4-hour chart of the DOT/USD pair. The trend line is close to the 76.4% Fib retracement level of the upward move from the $6.31 swing low to the $7.77 high.
Source: DOTUSD on TradingView.com
Immediate resistance is near the $7.05 level. The next major resistance is near $7.20. A successful break above $7.20 could start another strong rally. In the stated case, the price could easily rally toward $7.75 in the near term. The next major resistance is seen near the $8.00 zone.
More Losses in DOT?If DOT price fails to start a fresh increase above $7.05, it could continue to move down. The first key support is near the $6.65 level and the trend line.
The next major support is near the $6.30 level, below which the price might decline to $5.70. Any more losses may perhaps open the doors for a move toward the $5.00 support zone.
Technical Indicators
4-Hours MACD – The MACD for DOT/USD is now gaining momentum in the bearish zone.
4-Hours RSI (Relative Strength Index) – The RSI for DOT/USD is now below the 50 level.
Major Support Levels – $6.65, $6.30 and $5.70.
Major Resistance Levels – $7.05, $7.20, and $7.75.
Original source
Read on NewsBTCRelated market context

Uranium Holds Above $85 as Mining ETF Rebounds From June Sell-Off
The latest charts display that the market is divided into stable physical prices and uranium shares trying to regain momentum afte...

Bitcoin price challenges $64,000 weekend wall – needing a breakout or risk a deeper correction
Bitcoin reclaimed $64,000 on June 12 and touched an intraday high of $64,301 in the same session that spot ETF flows finally flipp...

Standard Chartered Says Bitcoin Bottomed Near $59,000 As Crypto Winter Ends
TL;DR Standard Chartered’s Geoffrey Kendrick reportedly says Bitcoin’s $59,000 area marked the cycle bottom. The note cites SpaceX...

Bitcoin rises above $64,000 after Pakistan prime minister says Iran peace deal is near
Bitcoin traded above $64,000 on Saturday, supported by its strongest ETF inflows in a month and growing optimism around geopolitic...

Are 24/7 CME Bitcoin futures a volatility cure — or a new leverage trap?
Wall Street got to trade Bitcoin around the clock just in time to watch the market fall apart. CME Group launched 24/7 trading for...

US forces shoot down Iranian attack drones near Strait of Hormuz, Bitcoin drops below $73K
Geopolitical tensions near vital oil routes can destabilize financial markets, highlighting the interconnectedness of global secur...