DOT Price (Polkadot) Indicators Suggest Strong Case For Fresh Rally
Polkadot’s DOT started a fresh increase from the $5.60 support against the US Dollar. It correcting gains, but indicators suggest high chances of a fresh increase. DOT is holding the ground above the $6.00 and $5.80 leve...

Polkadot’s DOT started a fresh increase from the $5.60 support against the US Dollar. It correcting gains, but indicators suggest high chances of a fresh increase.
- DOT is holding the ground above the $6.00 and $5.80 levels against the US dollar.
- The price is trading nicely above the $6.00 support and the 100 simple moving average (4-hours).
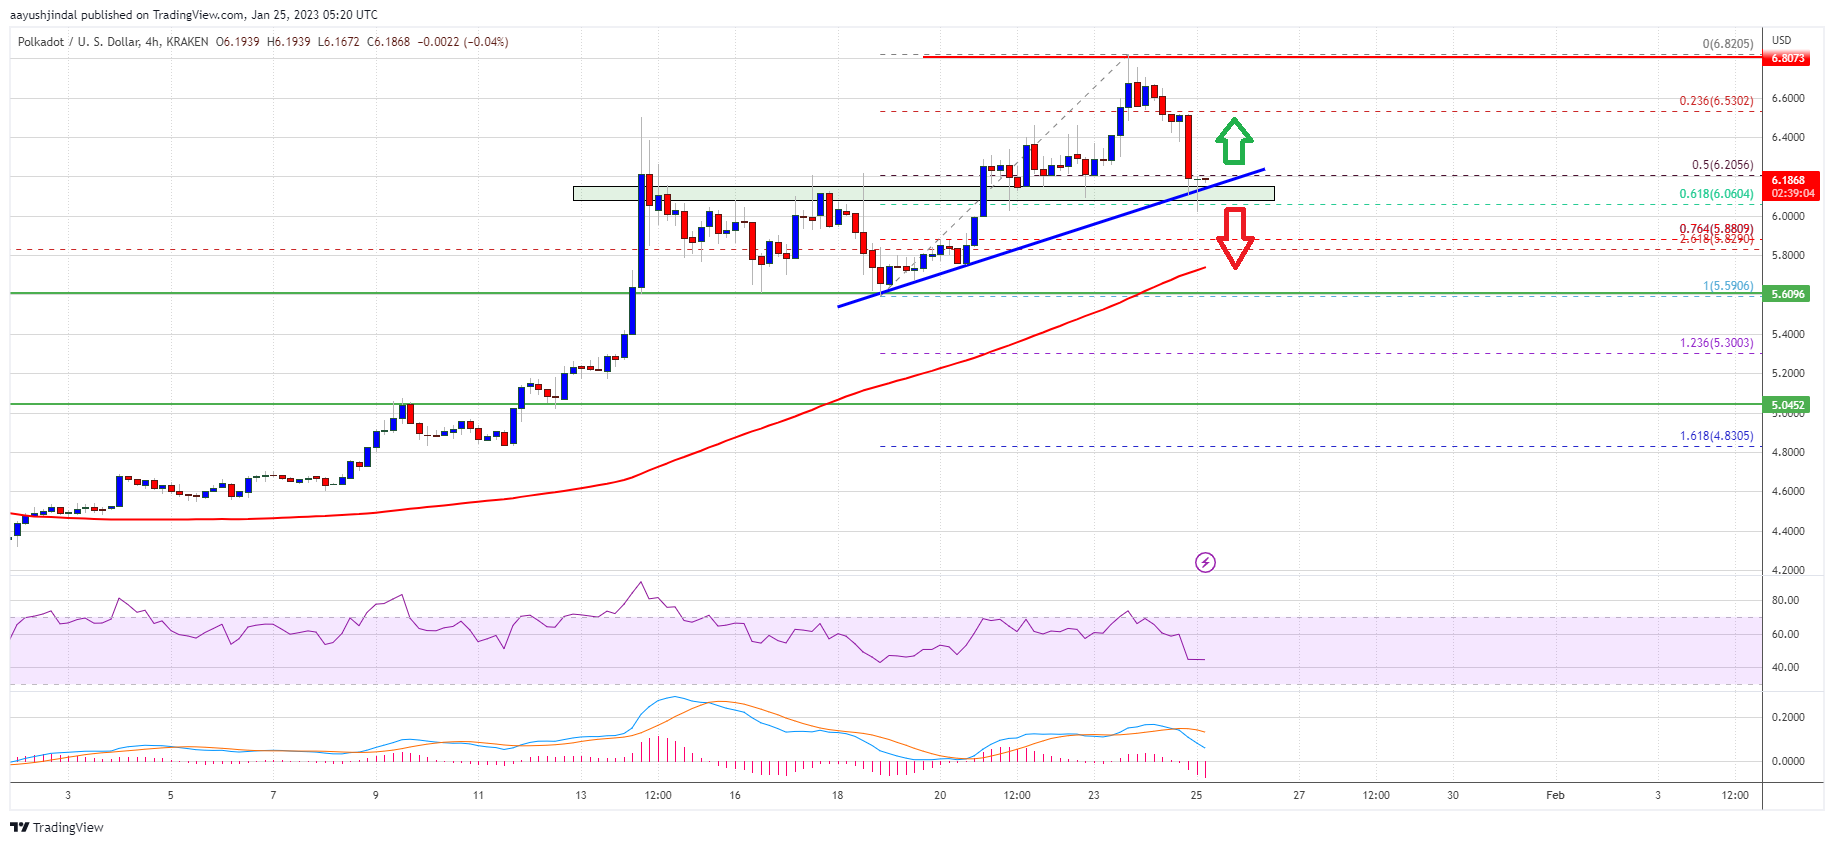
- There is a major bullish trend line forming with support near $6.05 on the 4-hours chart of the DOT/USD pair (data source from Kraken).
- The pair could start a strong rally once it clears the $6.40 and $6.50 resistance levels.
After forming a base above the $5.60 zone, DOT price started a fresh increase. It climbed above the $5.80 and $6.00 levels to move back into a positive zone.
The bulls were able to push the price above the $6.50 level and 100 simple moving average (4-hours). The price traded as high as $6.82 and recently started a downside correction, similar to bitcoin and ethereum. There was a move below the $6.50 level.
Dot price dipped below the 50% Fib retracement level of the upward move from the $5.59 swing low to $6.82 high. However, the bulls are protecting the $6.15 support zone.
There is also a major bullish trend line forming with support near $6.05 on the 4-hours chart of the DOT/USD pair. The bulls are also protecting the 61.8% Fib retracement level of the upward move from the $5.59 swing low to $6.82 high.
It is also above the $6.00 support and the 100 simple moving average (4-hours). An immediate resistance is near the $6.40 level. The main resistance is still near the $6.65 and $6.80 levels.
Source: DOTUSD on TradingView.com
A successful break above $6.65 and a close above $6.80 could start a strong rally. In the stated case, the price could easily rise 10%-15% in the near term.
Dips Limited?If DOT price fails to continue higher above $6.65 or $6.80, there could be more losses. The first key support is near the $6.05 and $6.00 levels.
The next major support is near the $5.80 level and the 100 simple moving average (4-hours). Any more losses may perhaps open the doors for a move towards the $5.50 support zone.
Technical Indicators
4-Hours MACD – The MACD for DOT/USD is now losing momentum in the bullish zone.
4-Hours RSI (Relative Strength Index) – The RSI for DOT/USD is now just below the 50 level.
Major Support Levels – $6.05, $6.00 and $5.80.
Major Resistance Levels – $6.40, $6.65 and $6.80.
Original source
Read on NewsBTCRelated market context

Standard Chartered Says Bitcoin Bottomed Near $59,000 As Crypto Winter Ends
TL;DR Standard Chartered’s Geoffrey Kendrick reportedly says Bitcoin’s $59,000 area marked the cycle bottom. The note cites SpaceX...

Switzerland’s World Cup stumble highlights growing gap between major sports events and crypto engagement
The diminishing crypto presence at major sports events may signal a shift in sponsorship dynamics and fan engagement strategies. T...

Elon Musk SpaceX AI Predicts Incredible Bitcoin Price For Next 30 Days
Here is the thing about capitulation calls. They only sound smart in hindsight. Right now, with Bitcoin price scraping along the l...

Bitcoin rises above $64,000 after Pakistan prime minister says Iran peace deal is near
Bitcoin traded above $64,000 on Saturday, supported by its strongest ETF inflows in a month and growing optimism around geopolitic...

Bitcoin faces one of its biggest mining difficulty drops as miner margins collapse
The Bitcoin network is poised to execute one of the largest downward adjustments to its mining difficulty in its 17-year history t...

Are 24/7 CME Bitcoin futures a volatility cure — or a new leverage trap?
Wall Street got to trade Bitcoin around the clock just in time to watch the market fall apart. CME Group launched 24/7 trading for...