DOT Price (Polkadot) Jumps 10%, Why Bulls Can Pump It To $12
Polkadot (DOT) is gaining pace above the $10.00 resistance against the US Dollar. The price could extend its rally toward the $12.00 level in the near term. DOT is gaining pace above the $9.80 and $10.00 levels against t...

Polkadot (DOT) is gaining pace above the $10.00 resistance against the US Dollar. The price could extend its rally toward the $12.00 level in the near term.
- DOT is gaining pace above the $9.80 and $10.00 levels against the US Dollar.
- The price is trading above the $10.00 zone and the 100 simple moving average (4 hours).
- There is a key bullish trend line forming with support at $9.10 on the 4-hour chart of the DOT/USD pair (data source from Kraken).
- The pair could continue to rise toward the $12 resistance zone.
After forming a base above the $8.00 level, DOT price started a fresh rally. It gained over 20% in a few days and even outperformed Ethereum and Bitcoin at times.
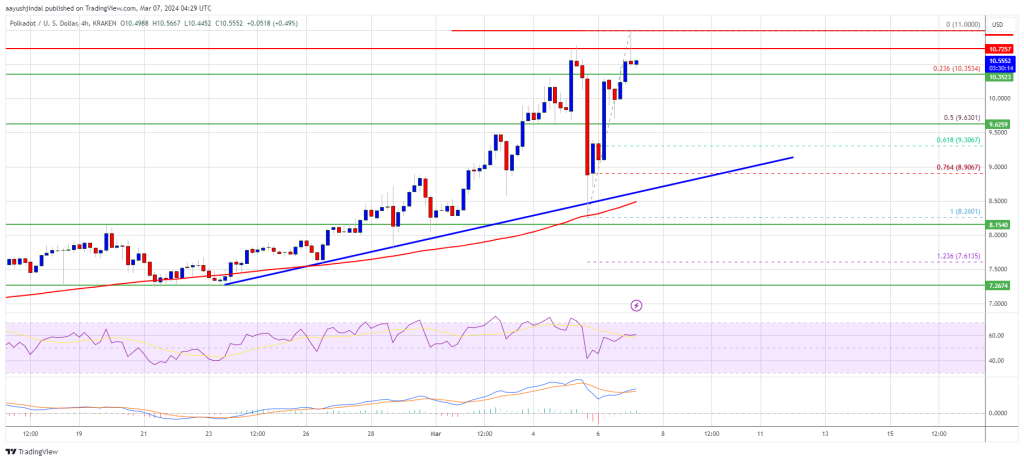
There was a clear move above the $9.50 and $10.00 resistance levels. The price traded to a new multi-month high at $11.00 and is currently consolidating gains. There was a minor pullback below the $10.75 level. The price is still above the 23.6% Fib retracement level of the upward move from the $8.26 swing low to the $11.00 high.
DOT is now trading well above the $10.00 zone and the 100 simple moving average (4 hours). There is also a key bullish trend line forming with support at $9.10 on the 4-hour chart of the DOT/USD pair. The trend line is close to the 61.8% Fib retracement level of the upward move from the $8.26 swing low to the $11.00 high.
Source: DOTUSD on TradingView.com
Immediate resistance is near the $10.75 level. The next major resistance is near $11.00. A successful break above $11.00 could start another strong rally. In the stated case, the price could easily rally toward $12.00 in the near term. The next major resistance is seen near the $13.50 zone.
Are Dips Supported in DOT?If DOT price fails to start a fresh increase above $11.00, it could start a downside correction. The first key support is near the $10.35 level.
The next major support is near the $10.00 level, below which the price might decline to $9.50. Any more losses may perhaps open the doors for a move toward the $9.20 support zone or the trend line.
Technical Indicators
4-Hours MACD – The MACD for DOT/USD is now gaining momentum in the bullish zone.
4-Hours RSI (Relative Strength Index) – The RSI for DOT/USD is now above the 50 level.
Major Support Levels – $10.35, $10.00 and $9.50.
Major Resistance Levels – $10.75, $11.00, and $12.00.
Original source
Read on NewsBTCRelated market context

BTC News Today: Bitcoin Climbs Toward $66K as Trump Reveals US-Iran Peace Deal
The renewed geopolitical optimism helped improve risk sentiment across financial markets, pushing Bitcoin back toward the $66,000...

Bitcoin Stabilizes Near Key Zone, But Glassnode Warns Capital Flows Remain Weak
Bitcoin’s rebound from the $60,000 area has given bulls something to work with, but Glassnode’s latest market read suggests the re...

Bitcoin Price and Crypto Stocks Surge as Iran Ceasefire, Strategy’s $100M Buy Collide With Fed Week
Bitcoin Magazine Bitcoin Price and Crypto Stocks Surge as Iran Ceasefire, Strategy’s $100M Buy Collide With Fed Week Bitcoin price...

XRP Price Prediction: Ripple Jumps 10% as Crypto Total Market Cap Closing $2.4T
XRP price is moving again, and this time, prediction and volume back it up. The token has run 10% in the past 24 hours, pushing th...

XRP Price Prediction: US-Iran Peace Deal Fuels 13% XRP Surge, Analysts Target $1.94 Retest
The latest move saw XRP price today reclaim the $1.28 level for the first time in nearly two weeks. Market participants pointed to...

Emerging-market stocks near record high as tech gains boost rally, leaving crypto behind
The tech-driven rally in emerging markets highlights a shift in capital allocation, potentially sidelining crypto as investors cha...