DOT Price (Polkadot) Looks Set To Crush $10 And Rally Further
Polkadot (DOT) is gaining pace above the $8.80 resistance against the US Dollar. The price could extend its rally once it settles above the $10 barrier. DOT is gaining pace above the $8.50 and $8.80 levels against the US...

Polkadot (DOT) is gaining pace above the $8.80 resistance against the US Dollar. The price could extend its rally once it settles above the $10 barrier.
- DOT is gaining pace above the $8.50 and $8.80 levels against the US Dollar.
- The price is trading above the $9.00 zone and the 100 simple moving average (4 hours).
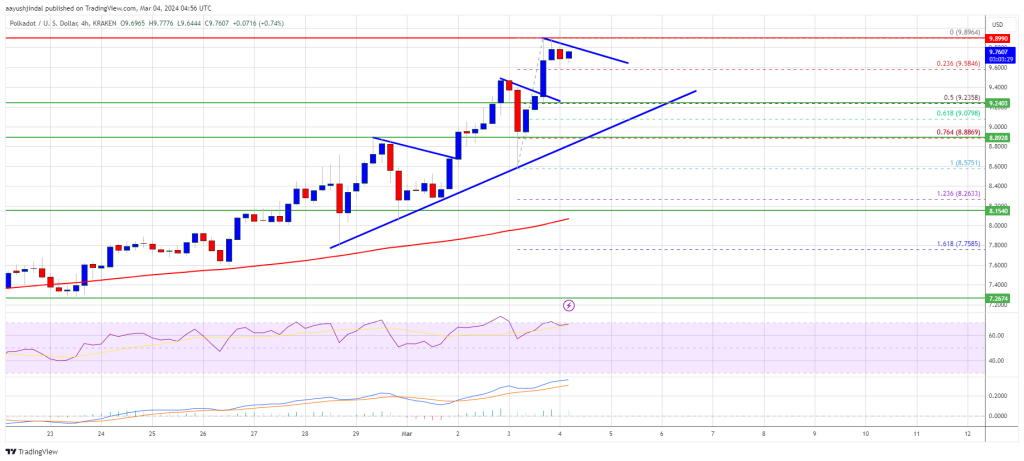
- There is a key bullish trend line forming with support at $9.20 on the 4-hour chart of the DOT/USD pair (data source from Kraken).
- The pair could continue to rise unless the bears are able to defend the $10 resistance zone.
After forming a base above the $7.50 level, DOT price started a steady increase. It gained over 25% in a few days and even outperformed Ethereum and Bitcoin at times.
There was a clear move above the $8.50 and $8.80 resistance levels. The price even traded close to the $10.00 level. A new multi-week high is formed near $9.89 and the price is now consolidating gains. It is holding gains above the 23.6% Fib retracement level of the upward move from the $8.57 swing low to the $9.89 high.
DOT is now trading above the $9.00 zone and the 100 simple moving average (4 hours). There is also a key bullish trend line forming with support at $9.20 on the 4-hour chart of the DOT/USD pair. The trend line is close to the 50% Fib retracement level of the upward move from the $8.57 swing low to the $9.89 high.
Source: DOTUSD on TradingView.com
Immediate resistance is near the $9.85 level. The next major resistance is near $10.00. A successful break above $10.00 could start another strong rally. In the stated case, the price could easily rally toward $12.00 in the near term. The next major resistance is seen near the $13.50 zone.
Are Dips Supported in DOT?If DOT price fails to start a fresh increase above $10.00, it could start a downside correction. The first key support is near the $9.50 level.
The next major support is near the $9.20 level, below which the price might decline to $8.80. Any more losses may perhaps open the doors for a move toward the $8.50 support zone.
Technical Indicators
4-Hours MACD – The MACD for DOT/USD is now gaining momentum in the bullish zone.
4-Hours RSI (Relative Strength Index) – The RSI for DOT/USD is now above the 50 level.
Major Support Levels – $9.50, $9.20 and $8.50.
Major Resistance Levels – $9.85, $10.00, and $12.00.
Original source
Read on NewsBTCRelated market context

Bitcoin Stabilizes Near Key Zone, But Glassnode Warns Capital Flows Remain Weak
Bitcoin’s rebound from the $60,000 area has given bulls something to work with, but Glassnode’s latest market read suggests the re...

Bitcoin’s Iran rally faces Japan rate test as it weighs 31-year high
Bitcoin's current relief rally is built on the back of the framework agreement between the US and Iran to halt their conflict and...

Bitcoin Price and Crypto Stocks Surge as Iran Ceasefire, Strategy’s $100M Buy Collide With Fed Week
Bitcoin Magazine Bitcoin Price and Crypto Stocks Surge as Iran Ceasefire, Strategy’s $100M Buy Collide With Fed Week Bitcoin price...

BTC News Today: Bitcoin Climbs Toward $66K as Trump Reveals US-Iran Peace Deal
The renewed geopolitical optimism helped improve risk sentiment across financial markets, pushing Bitcoin back toward the $66,000...

XRP Price Prediction: Ripple Jumps 10% as Crypto Total Market Cap Closing $2.4T
XRP price is moving again, and this time, prediction and volume back it up. The token has run 10% in the past 24 hours, pushing th...

XRP Price Prediction: US-Iran Peace Deal Fuels 13% XRP Surge, Analysts Target $1.94 Retest
The latest move saw XRP price today reclaim the $1.28 level for the first time in nearly two weeks. Market participants pointed to...