DOT Price (Polkadot) Surge to $5.5 – Are Bulls Ready For This?
Polkadot (DOT) is gaining pace above the $4.50 resistance against the US Dollar. The price could surge toward $5.5 if it clears the $4.80 resistance. DOT is slowly moving higher above the $4.50 resistance zone against th...

Polkadot (DOT) is gaining pace above the $4.50 resistance against the US Dollar. The price could surge toward $5.5 if it clears the $4.80 resistance.
- DOT is slowly moving higher above the $4.50 resistance zone against the US Dollar.
- The price is trading above the $4.60 zone and the 100 simple moving average (4 hours).
- There is a key bullish trend line forming with support near $4.50 on the 4-hour chart of the DOT/USD pair (data source from Kraken).
- The pair could gain bullish momentum if there is a close above $4.80 and $4.85.
After forming a base above the $4.00 handle, DOT price started a decent increase. The price was able to clear the key barrier at $4.20 to enter a positive zone, like Bitcoin and Ethereum.
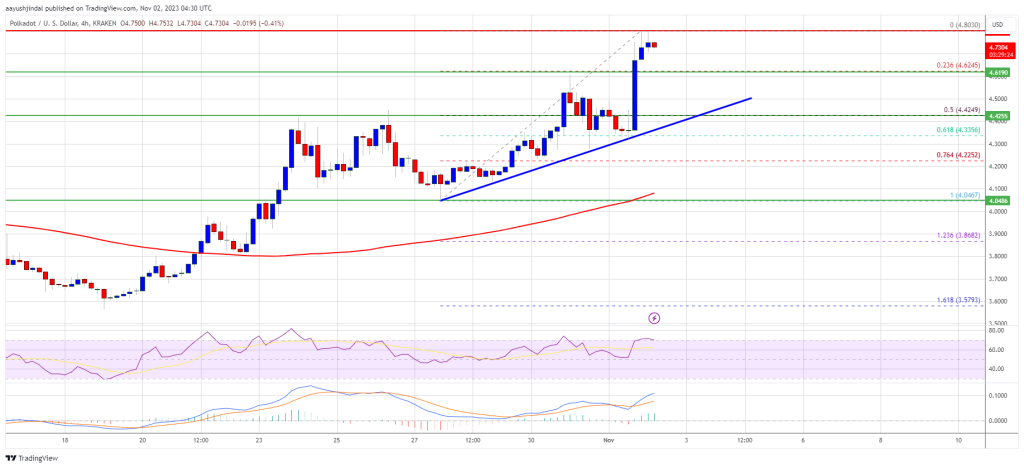
Polkadot cleared the $4.50 resistance zone and the 100 simple moving average (4 hours). It traded to a new multi-week high at $4.803 and is now consolidating gains. It is well above the 23.6% Fib retracement level of the upward move from the $4.046 swing low to the $4.803 high.
DOT price is now trading above the $4.60 zone and the 100 simple moving average (4 hours). There is also a key bullish trend line forming with support near $4.50 on the 4-hour chart of the DOT/USD pair. The trend line is close to the 50% Fib retracement level of the upward move from the $4.046 swing low to the $4.803 high.
Source: DOTUSD on TradingView.com
Immediate resistance is near the $4.80 level. The next major resistance is near $4.85. A successful break above $4.85 could start another strong rally. In the stated case, the price could easily rally toward $5.20 in the coming days. The next major resistance is seen near the $5.50 zone.
Are Dips Supported in DOT?If DOT price fails to continue higher above $4.80 or $4.85, it could start a downside correction. The first key support is near the $4.62 level.
The next major support is near the $4.50 level and the trend line, below which the price might decline to $4.35. Any more losses may perhaps open the doors for a move toward the $4.20 support zone.
Technical Indicators
4-Hours MACD – The MACD for DOT/USD is now gaining momentum in the bullish zone.
4-Hours RSI (Relative Strength Index) – The RSI for DOT/USD is now above the 50 level.
Major Support Levels – $4.62, $4.50 and $4.20.
Major Resistance Levels – $4.80, $4.85, and $5.50.
Original source
Read on NewsBTCRelated market context

Uranium Holds Above $85 as Mining ETF Rebounds From June Sell-Off
The latest charts display that the market is divided into stable physical prices and uranium shares trying to regain momentum afte...

Standard Chartered Says Bitcoin Bottomed Near $59,000 As Crypto Winter Ends
TL;DR Standard Chartered’s Geoffrey Kendrick reportedly says Bitcoin’s $59,000 area marked the cycle bottom. The note cites SpaceX...

Google Gemini AI Predicts Jaw-Dropping XRP Price For Next 90 Days
Google Gemini AI just put XRP back under the spotlight, predicting it is tightly wound for a major breakout toward $1.60 to $1.80...

Bitcoin price challenges $64,000 weekend wall – needing a breakout or risk a deeper correction
Bitcoin reclaimed $64,000 on June 12 and touched an intraday high of $64,301 in the same session that spot ETF flows finally flipp...

Bitcoin rises above $64,000 after Pakistan prime minister says Iran peace deal is near
Bitcoin traded above $64,000 on Saturday, supported by its strongest ETF inflows in a month and growing optimism around geopolitic...

Bitcoin Mining Cost Model Points To $47,000 Floor, But Analysts Urge Caution
TL;DR Crypto Rover says Bitcoin has never bottomed below electrical production cost, currently estimated at $47,000. Mining-cost m...