FET Gears Up for Gains: Bullish Momentum Eyes $1.8 Breakout
FET is showing renewed positive strength, with recent price action suggesting a breakout toward the $1.8 resistance level may be on the horizon. After bouncing back from key support zones, the cryptocurrency has caught t...
Archive context
Older archive item. Useful for background and entity history, but not a fresh market-moving signal.

FET is showing renewed positive strength, with recent price action suggesting a breakout toward the $1.8 resistance level may be on the horizon. After bouncing back from key support zones, the cryptocurrency has caught the attention of traders as upward pressure begins to build. With buying interest growing and technical indicators showing signs of strength, the stage is set for FET to potentially reclaim higher price levels, positioning $1.8 as a crucial target for bulls looking to extend the rally.
The aim of this article is to analyze FET’s recent bullish momentum as it approaches the $1.8 resistance level. By examining key technical indicators, price patterns, and market sentiment, this piece seeks to assess the likelihood of a breakout and the potential for further upside movement in the near term.
Indicators Point Toward More Upward Movement For FETOn the 4-hour chart, FET is exhibiting bullish signs as it aims to break above the 100-day Simple Moving Average (SMA). A push above this key technical indicator successfully could attract large buying interest, indicating that the bulls are regaining control and setting the stage for additional gains toward the $1.8 resistance level.
An analysis of the 4-hour Relative Strength Index (RSI) reveals a renewed bullish potential, as the RSI has climbed above the 50% threshold and is currently sitting at 58%. This upward shift indicates increasing buying pressure. If the RSI continues on this trajectory, it could signal more upward movements for FET, paving the way for new highs, and reinforcing the bullish trend.
After successfully avoiding a drop below the daily 100-day SMA, FET has positioned itself firmly above this key level, indicating that buyers have regained control. Holding above this crucial technical indicator suggests that FET may continue its upward trajectory, with the 100-day SMA now acting as a solid support level, further reinforcing the potential for continued gains.
Also, the RSI on the daily chart is currently sitting at 54%, after a previous dip to 44%. The rise from lower levels indicates that FET may be regaining strength, with the potential for more growth if buying interest remains consistent.
What Could Happen Beyond $1.8?FET is currently on an upward trajectory, eyeing a breakout above the $1.8 resistance level. A successful push beyond this mark could pave the way for further gains, with the next target set around $2.5. Should FET surpass $2.5, increased buying interest could fuel additional momentum, driving the price higher toward the $3.4 resistance level.
However, failure to sustain momentum and break below the $1.8 resistance could lead to a pullback toward the $0.966 support level. If the price drops below this critical point, it may trigger additional declines, potentially opening the door for deeper price corrections.
Why this matters
This cryptocurrency story adds another data point to the current market tape and is useful when read alongside nearby source coverage.
Original source
Read on NewsBTCRelated market context

XRP Price Prediction: Weekly Gains Lead Crypto Market, But Can XRP Clear $1.63?
XRP price trades at $1.53, up by a marginal 1.5% on the day, and is still sitting on one of the strongest weekly charts among larg...
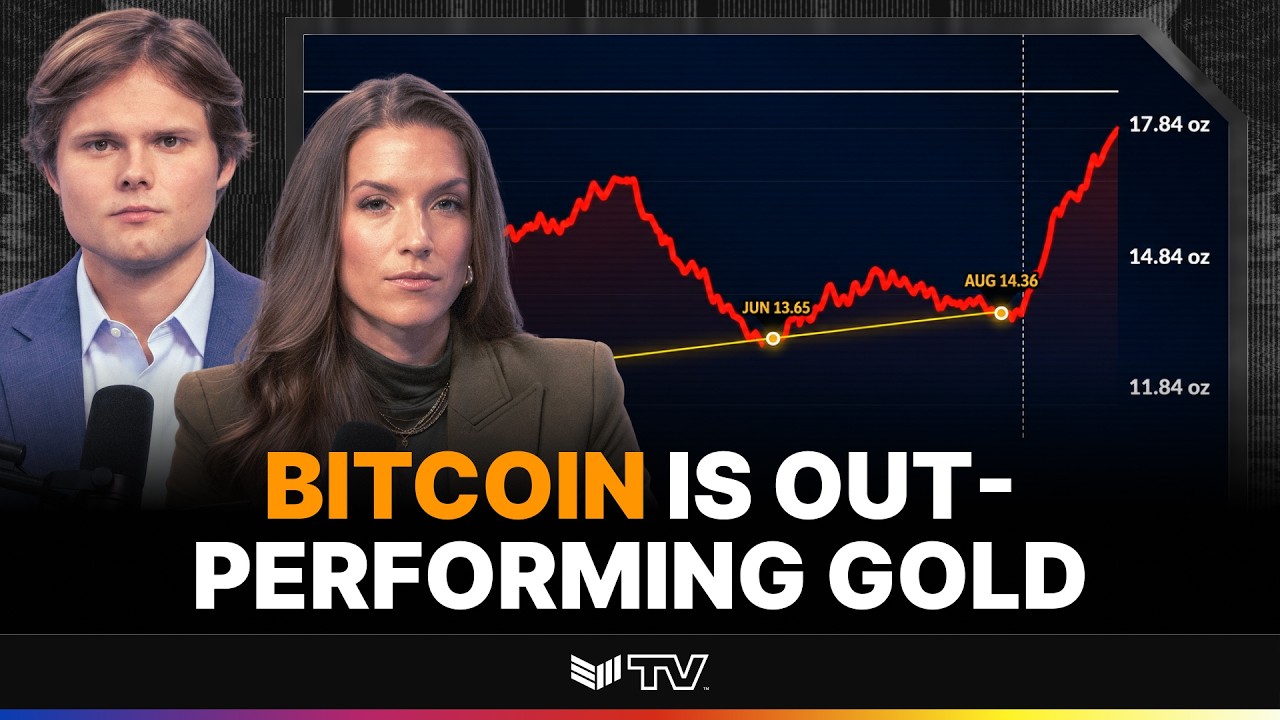
TECHNICAL ANALYSIS: BTC to Cross Key Price Level Against Gold
Bitcoin Magazine TECHNICAL ANALYSIS: BTC to Cross Key Price Level Against Gold The 90-day correlation between Bitcoin and gold jus...

Ethereum (ETH) Price Prediction: Bulls and Bears Face Off as $3,000 Rally Meets Liquidation Risk
Ethereum price is entering a volatile phase after its latest recovery, with buyers trying to defend the recent breakout while sell...

Bitcoin (BTC) Price Today: BTC Holds Uptrend as $84K FVG Shapes Intraday Setup
The setup comes as on-chain data shows that profit-taking remains relatively contained despite the latest Bitcoin price recovery....

Bitcoin Falls Back Below $85K As Treasury Yields Jump Above 5%
TL;DR Bitcoin fell below $85,000 after stronger U.S. business data pushed Treasury yields higher. S&P Global’s flash U.S. Composit...

Elon Musk Grok AI Predicts a Bold Move for Ethereum in 2026
When prompted, the Elon Musk-backed Grok AI predicts a bold move for Ethereum (ETH) over the remainder of 2026. It claims that if...