Huobi Token Price Prediction: Break This And HT Price Could Surge To $10
Huobi Token (HT) price started a major increase above $5.00 against the US Dollar. It is now facing a major resistance at $6.85, above which it could rally to $10.00. Huobi Token price gained over 50% in a few days and b...

Huobi Token (HT) price started a major increase above $5.00 against the US Dollar. It is now facing a major resistance at $6.85, above which it could rally to $10.00.
- Huobi Token price gained over 50% in a few days and broke the $5.00 resistance.
- The price is now trading above $5.00 and the 100-day hourly simple moving average.
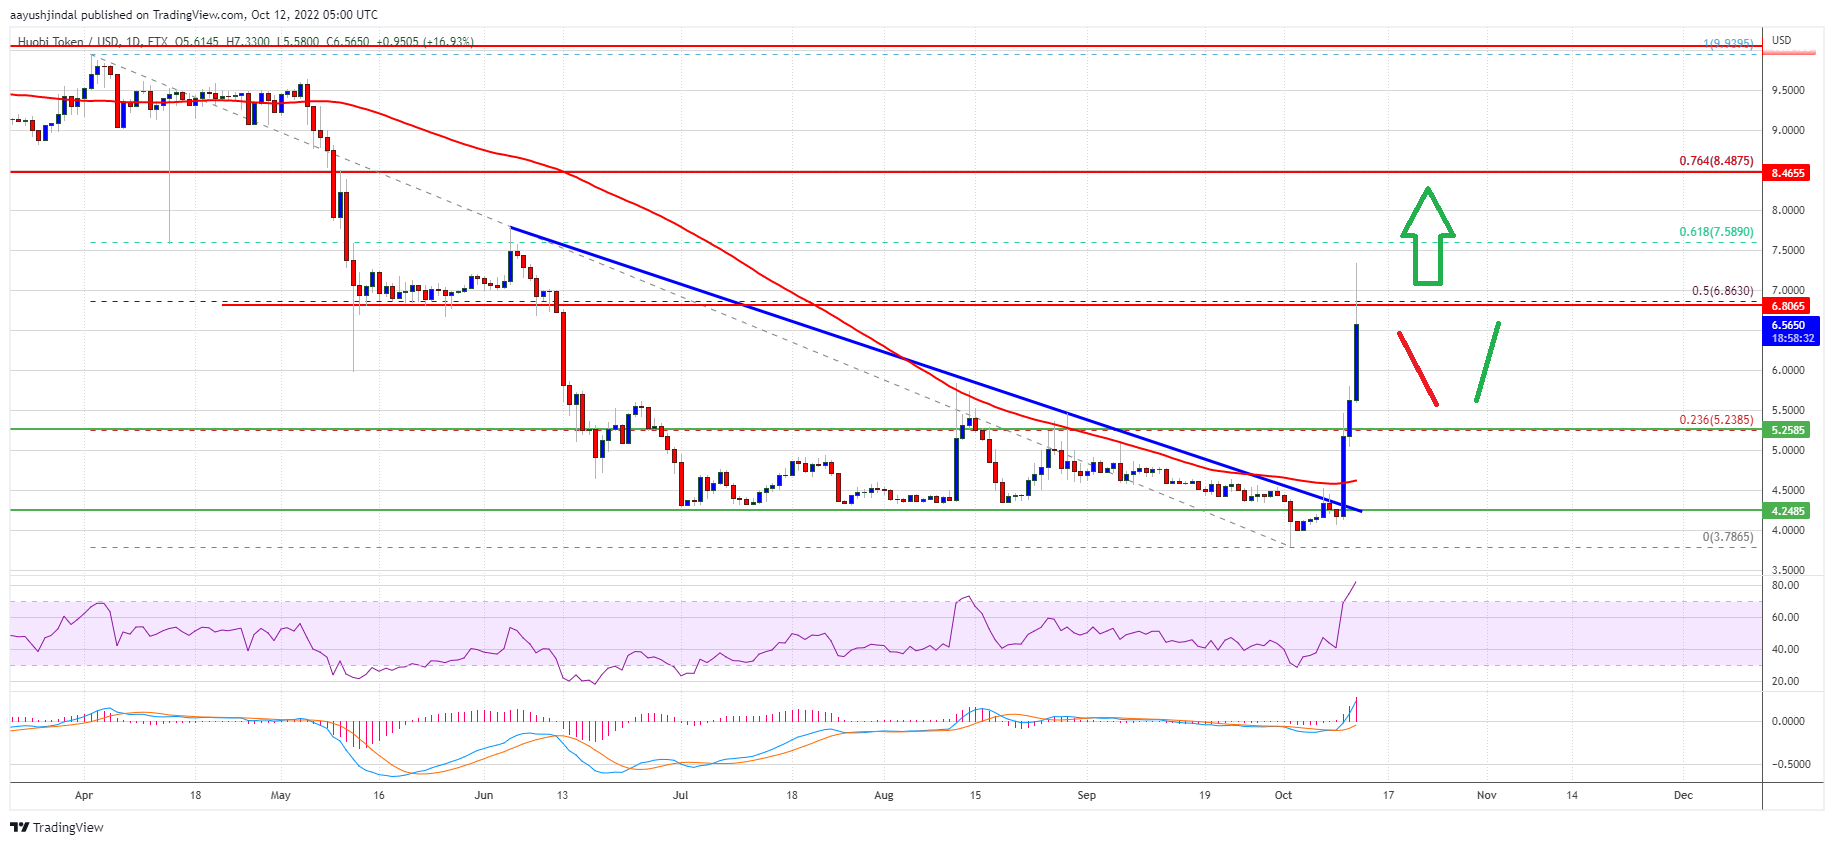
- There was a break above a major bearish trend line with resistance near $4.50 on the daily chart of HT/USD (data feed via FTX).
- The pair could rally further to $10.00 if it clears the $6.85 resistance zone.
Huobi Token formed a strong base above the $4.00 zone. HT price started a fresh rally above the $4.20 and $4.50 resistance levels. The bulls were able to push the price above the $5.00 resistance and the 100-day hourly simple moving average.
During the rally, there was a break above a major bearish trend line with resistance near $4.50 on the daily chart of HT/USD. The price gained pace and was able to clear the 38.2% Fib retracement level of the main drop from the $9.93 swing high to $3.78 low.
It is up over 25% in a day (unlike bitcoin and ethereum) and surpassed the $6.00 resistance level. It is now facing a strong resistance near the $6.85 level. The stated resistance is near the 50% Fib retracement level of the main drop from the $9.93 swing high to $3.78 low.
Source: HTUSD on TradingView.com
The next major resistance sits near the $7.50 level. A close above the $6.85 and $7.50 levels could pump the price further higher. In the stated case, HT price could revisit the $9.95 level or even test the $10.00 resistance.
Dips Supported in HT?If HT price fails to surpass the $6.85 and $7.50 resistance levels, it could start a downside correction. An initial support on the downside is near the $6.00 level.
The next major support is near the $5.50 level. A downside break below the $5.50 might start a major downside correction. In the stated case, Huobi Token price may perhaps decline towards the $5.00 level.
Technical Indicators
Daily MACD – The MACD for HT/USD is now gaining momentum in the bullish zone.
Daily RSI – The RSI for HT/USD is now in the overbought zone.
Major Support Level – $6.00
Major Resistance Level – $6.85
Original source
Read on NewsBTCRelated market context

Bitcoin price challenges $64,000 weekend wall – needing a breakout or risk a deeper correction
Bitcoin reclaimed $64,000 on June 12 and touched an intraday high of $64,301 in the same session that spot ETF flows finally flipp...

Uranium Holds Above $85 as Mining ETF Rebounds From June Sell-Off
The latest charts display that the market is divided into stable physical prices and uranium shares trying to regain momentum afte...

Elon Musk SpaceX AI Predicts Incredible Bitcoin Price For Next 30 Days
Here is the thing about capitulation calls. They only sound smart in hindsight. Right now, with Bitcoin price scraping along the l...

Bitcoin price faces new risk as big buyers lose conviction
Bitcoin’s largest buyers are no longer behaving like a reliable backstop for the largest cryptocurrency. The exchange-traded funds...

Google Gemini AI Predicts Jaw-Dropping XRP Price For Next 90 Days
Google Gemini AI just put XRP back under the spotlight, predicting it is tightly wound for a major breakout toward $1.60 to $1.80...

Bitcoin Mining Cost Model Points To $47,000 Floor, But Analysts Urge Caution
TL;DR Crypto Rover says Bitcoin has never bottomed below electrical production cost, currently estimated at $47,000. Mining-cost m...