Litecoin Price Prediction: Bullish Break To $120 Still In Sight
Litecoin price extended its increase above the $90 zone against the US Dollar. LTC is rising and might attempt a fresh rally above the $100 resistance. Litecoin started a fresh increase above the $90 zone against the US...

Litecoin price extended its increase above the $90 zone against the US Dollar. LTC is rising and might attempt a fresh rally above the $100 resistance.
- Litecoin started a fresh increase above the $90 zone against the US Dollar.
- The price is now trading above $90 and the 100 simple moving average (4-hours).
- There is a key bullish trend line forming with support near $89.50 on the 4-hours chart of the LTC/USD pair (data feed from Kraken).
- The price could start another rally if there is a clear move above the $100 resistance.
This past week, litecoin price formed a support base above the $85 level against the US Dollar. LTC price started a steady increase above the $90 resistance zone, outperforming bitcoin and ethereum.
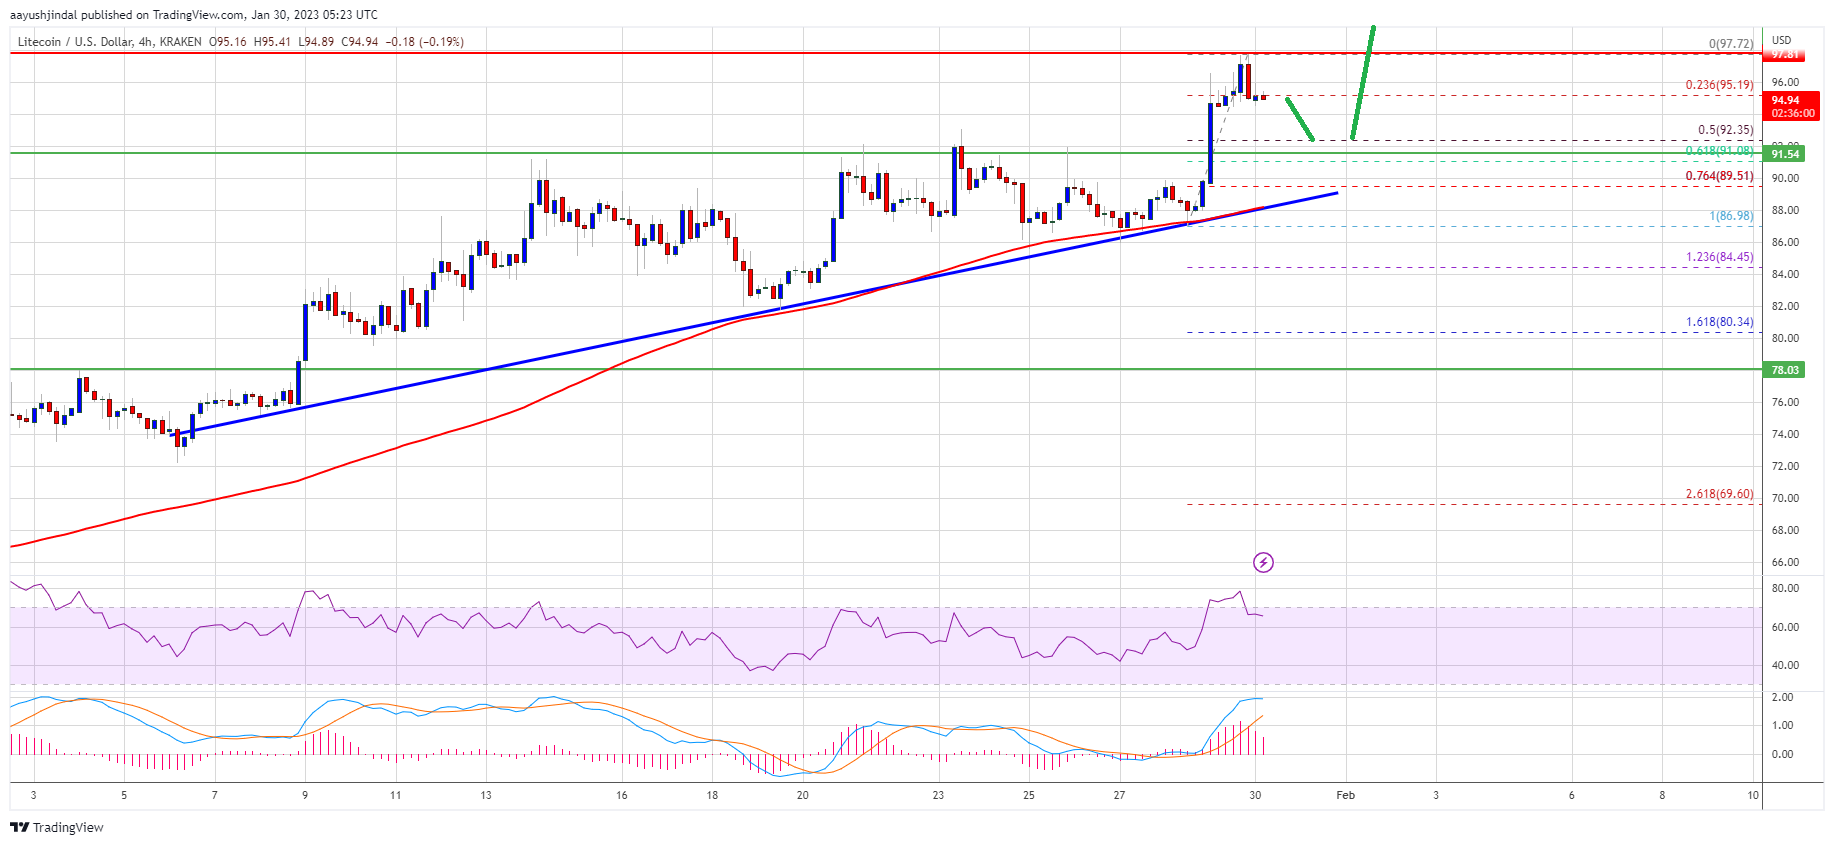
The bulls were able to push the price above the $95 resistance. A new yearly high was formed near $97.72 and the price is now consolidating gains. It is trading near the 23.6% Fib retracement level of the recent increase from the $86.98 swing low to $97.72 high.
Litecoin price is now trading above $90 and the 100 simple moving average (4-hours). There is also a key bullish trend line forming with support near $89.50 on the 4-hours chart of the LTC/USD pair.
Source: LTCUSD on TradingView.com
On the upside, an immediate resistance is near the $97.75 level. The next major resistance is near the $100 level. If there is a clear break above the $100 resistance, the price could start a strong increase. In the stated case, the price is likely to continue higher towards the $108 and $115 levels. Any more gains might send ltc price towards the $120 resistance zone.
Dips Limited in LTC?If Litecoin price fails to clear the $100 resistance level, there could be a downside correction. An initial support on the downside is near the $92.50 level.
The first major support is forming near the $90 level or the 76.4% Fib retracement level of the recent increase from the $86.98 swing low to $97.72 high or the trend line. Any further losses may perhaps send the price towards the $85 support.
Technical indicators:
4-hours MACD – The MACD is slowly losing pace in the bullish zone.
4-hours RSI (Relative Strength Index) – The RSI for LTC/USD is above the 50 level.
Major Support Levels – $92.50 followed by $90.00.
Major Resistance Levels – $97.75 and $100.00.
Original source
Read on NewsBTCRelated market context

Uranium Holds Above $85 as Mining ETF Rebounds From June Sell-Off
The latest charts display that the market is divided into stable physical prices and uranium shares trying to regain momentum afte...

Standard Chartered Says Bitcoin Bottomed Near $59,000 As Crypto Winter Ends
TL;DR Standard Chartered’s Geoffrey Kendrick reportedly says Bitcoin’s $59,000 area marked the cycle bottom. The note cites SpaceX...

Bitcoin Mining Cost Model Points To $47,000 Floor, But Analysts Urge Caution
TL;DR Crypto Rover says Bitcoin has never bottomed below electrical production cost, currently estimated at $47,000. Mining-cost m...

Tether USDT Briefly Overtakes Ethereum in Market Cap: A $187B Wake-Up Call
For a few hours, earlier this week, Tether USDT stablecoin held a higher market cap than Ethereum, the first time that has happene...

Google Gemini AI Predicts Jaw-Dropping XRP Price For Next 90 Days
Google Gemini AI just put XRP back under the spotlight, predicting it is tightly wound for a major breakout toward $1.60 to $1.80...

Bitcoin price challenges $64,000 weekend wall – needing a breakout or risk a deeper correction
Bitcoin reclaimed $64,000 on June 12 and touched an intraday high of $64,301 in the same session that spot ETF flows finally flipp...