Litecoin Price Prediction: LTC Recovery at Clear Risk on Two Factors
Litecoin price is attempting a recovery wave from $75 against the US Dollar. LTC could struggle to clear $82 or $85 and might start another decline. Litecoin is slowly moving higher and correcting toward $82 against the...

Litecoin price is attempting a recovery wave from $75 against the US Dollar. LTC could struggle to clear $82 or $85 and might start another decline.
- Litecoin is slowly moving higher and correcting toward $82 against the US Dollar.
- The price is now trading above $85 and the 100 simple moving average (4 hours).
- There was a break below a key rising channel with support near $86 on the 4-hour chart of the LTC/USD pair (data feed from Kraken).
- The price could face a strong resistance near $82 and $85 levels.
This past week, Litecoin’s price struggled near the $90 resistance against the US Dollar. LTC price started a fresh decline and traded below the $85 support, similar to Bitcoin and Ethereum.
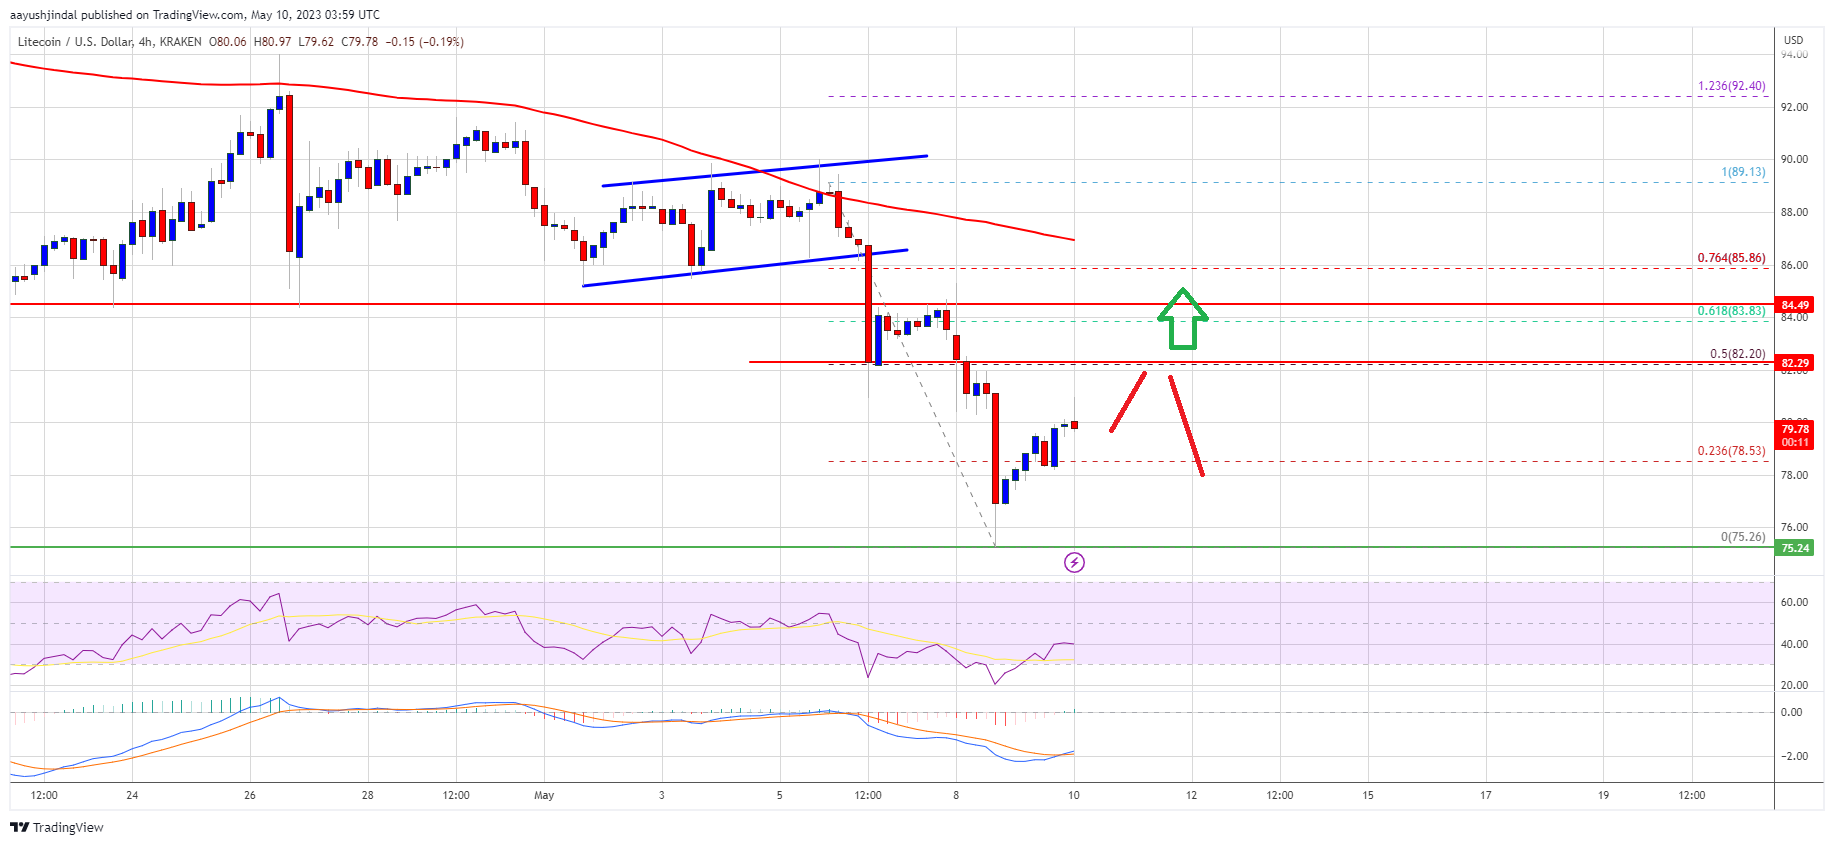
Besides, there was a break below a key rising channel with support near $86 on the 4-hour chart of the LTC/USD pair. The pair traded below the $80 support level. A low is formed near $75.26 and the price is now attempting a recovery wave.
LTC is now trading above $85 and the 100 simple moving average (4 hours). The price managed to climb above the 23.6% Fib retracement level of the downward move from the $89.13 swing high to the $75.26 low.
On the upside, immediate resistance is near the $82 zone. It is close to the 50% Fib retracement level of the downward move from the $89.13 swing high to the $75.26 low. The next major resistance is near the $85 level. If there is a clear break above the $85 resistance, the price could start another strong increase.
Source: LTCUSD on TradingView.com
In the stated case, the price is likely to continue higher toward the $90 and $92 levels. Any more gains might send LTC’s price toward the $100 resistance zone.
Fresh Decline in LTC?If Litecoin price fails to clear the $82 resistance level, there could be a fresh decline. Initial support on the downside is near the $78 level.
The next major support is forming near the $75 level, below which there is a risk of a move toward the $72 support. Any further losses may perhaps send the price toward the $65 support.
Technical indicators:
4-hour MACD – The MACD is now gaining pace in the bullish zone.
4-hour RSI (Relative Strength Index) – The RSI for LTC/USD is below the 50 level.
Major Support Levels – $78.00 followed by $75.00.
Major Resistance Levels – $82.00 and $85.00.
Original source
Read on NewsBTCRelated market context

Uranium Holds Above $85 as Mining ETF Rebounds From June Sell-Off
The latest charts display that the market is divided into stable physical prices and uranium shares trying to regain momentum afte...

Elon Musk’s trillionaire status puts his net worth above crypto’s entire market cap outside Bitcoin
Elon Musk has become the first person in modern history to amass a personal net worth exceeding $1 trillion, crossing the historic...

Bitcoin price challenges $64,000 weekend wall – needing a breakout or risk a deeper correction
Bitcoin reclaimed $64,000 on June 12 and touched an intraday high of $64,301 in the same session that spot ETF flows finally flipp...

Are 24/7 CME Bitcoin futures a volatility cure — or a new leverage trap?
Wall Street got to trade Bitcoin around the clock just in time to watch the market fall apart. CME Group launched 24/7 trading for...

Tether USDT Briefly Overtakes Ethereum in Market Cap: A $187B Wake-Up Call
For a few hours, earlier this week, Tether USDT stablecoin held a higher market cap than Ethereum, the first time that has happene...

Google Gemini AI Predicts Jaw-Dropping XRP Price For Next 90 Days
Google Gemini AI just put XRP back under the spotlight, predicting it is tightly wound for a major breakout toward $1.60 to $1.80...