Litecoin Price Prediction: This Resistance Could Trigger New Rally
Litecoin price remained well bid above the $60 support zone against the US Dollar. LTC is rising and might attempt a fresh rally above the $70 level. Litecoin started a fresh decline below $80 support against the US Doll...
Archive context
Older archive item. Useful for background and entity history, but not a fresh market-moving signal.

Litecoin price remained well bid above the $60 support zone against the US Dollar. LTC is rising and might attempt a fresh rally above the $70 level.
- Litecoin started a fresh decline below $80 support against the US Dollar.
- The price is now trading below $70 and the 100 simple moving average (4-hours).
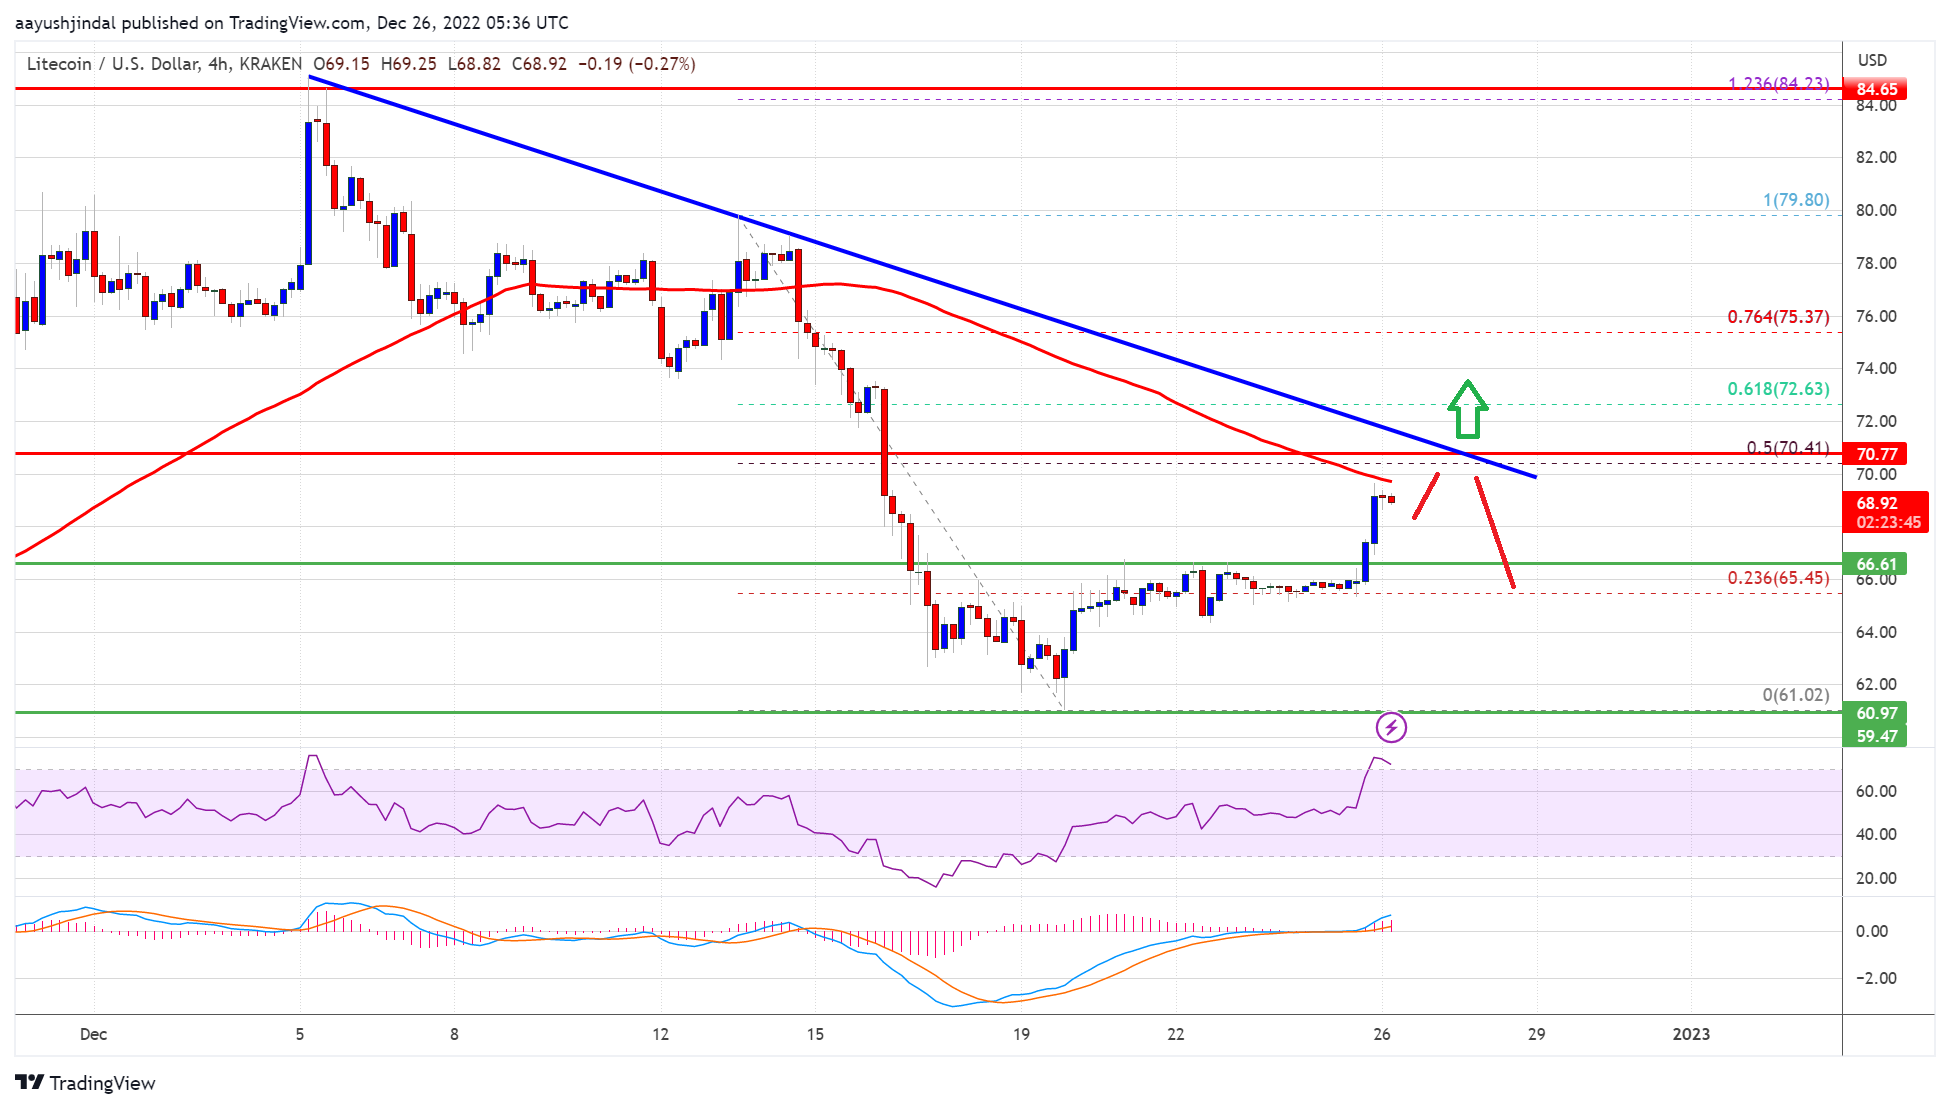
- There is a key bearish trend line forming with resistance near $70.50 on the 4-hours chart of the LTC/USD pair (data feed from Kraken).
- The price could start a decent increase if there is a clear move above the $72 resistance.
Earlier this month, litecoin price saw a steady decline from well above the $80 level against the US Dollar. LTC price declined below the $75 support zone to move into a bearish zone, similar to bitcoin and ethereum.
The price gained pace below the $70 support and the 100 simple moving average (4-hours). A low was formed near $61.02 and the price is now attempting a recovery wave. There was a decent upside correction above the $63 and $65 levels.
There was a move above the 23.6% Fib retracement level of the key decline from the $79.80 swing high to $61.02 low. The price is now trading near the $70 resistance and 100 simple moving average (4-hours).
On the upside, an immediate resistance is near the $70.00 level. There is also a key bearish trend line forming with resistance near $70.50 on the 4-hours chart of the LTC/USD pair. The trend line is near the 50% Fib retracement level of the key decline from the $79.80 swing high to $61.02 low.
Source: LTCUSD on TradingView.com
If there is a clear break above the $70.50 resistance, the price could start a strong increase. In the stated case, the price is likely to continue higher towards the $72 and $75 levels. Any more gains might send ltc price towards the $80 resistance zone.
Fresh Decline in LTC?If Litecoin price fails to clear the $70.00 resistance level, there could be a fresh decline. An initial support on the downside is near the $65.50 level.
The first major support is forming near the $64.00 level. Any further losses may perhaps send the price towards the $60.00 support in the coming sessions.
Technical indicators:
4-hours MACD – The MACD is slowly gaining pace in the bullish zone.
4-hours RSI (Relative Strength Index) – The RSI for LTC/USD is above the 50 level.
Major Support Levels – $65.50 followed by $60.00.
Major Resistance Levels – $70.00 and $75.00.
Why this matters
This cryptocurrency story adds another data point to the current market tape and is useful when read alongside nearby source coverage.
Original source
Read on NewsBTCRelated market context

Claude AI Predicts an Astonishing Price for Ethereum: Is Claude Broken?
Anthropic’s Claude AI predicts an unbelievable price for Ethereum (ETH USD), saying it could hit as high as $80,000 by January 1,...

Grok AI Predicts Something Big Is Brewing for XRP by Jan 1, 2027
Elon Musk’s Grok AI predicts an incredible XRP price by the end of 2026. This isn’t a standard bullish outlook. It’s an extreme, o...

Bitcoin Faces $85,000–$87,500 Supply Test After $80,000 Rebound
TL;DR: Glassnode’s October 21 report identifies an overhead Bitcoin supply zone around $85,000–$87,500 after bids returned near $8...

Binance cuts nearly three hours of Blue Ocean data from US stock perp funding
Binance's exclusion of faulty data highlights the risks of relying on third-party systems, emphasizing the need for robust risk ma...

XRP Price Falls as Crypto Longs Get Wiped Out and XRPL Upgrade Delayed
The XRP price fell below $1.35 just now after an attempted recovery toward $1.40 lost momentum. Not just XRP, renewed selling pres...

Mark Zuckerberg Meta AI Predicts an Insane Run for BTC in Q4
Something potentially seismic could be approaching for Bitcoin by January 1, 2027. Mark Zuckerberg’s Meta AI predicts that if a fu...