Litecoin Wobbles Under Pressure: Can It Find Footing Below $87?
Grayhoood, a crypto trader, said on X that Litecoin is currently experiencing a bearish trend, emphasizing the ongoing weakness in price action. Over the past 24 hours, LTC has decreased by 2.8%, and the candlestick char...
Archive context
Older archive item. Useful for background and entity history, but not a fresh market-moving signal.

Grayhoood, a crypto trader, said on X that Litecoin is currently experiencing a bearish trend, emphasizing the ongoing weakness in price action. Over the past 24 hours, LTC has decreased by 2.8%, and the candlestick charts reflect a noticeable downward movement.
As shown in the chart he referenced, LTC started the day around $89.00 but faced a sharp decline, dropping to $87.00 before managing a brief recovery to $88.50. However, the price has since fallen again to $84, indicating sustained selling pressure in the short term.
Momentum Fades: RSI Drifts Toward Oversold TerritoryAccording to Grayhoood, current technical indicators suggest that Litecoin may face further downside, with multiple metrics aligning to support a bearish short-term outlook. One of the primary indicators in focus is the Relative Strength Index (RSI), which appears to be drifting toward oversold territory.
While such a move could hint at a potential bounce, Grayhoood cautions that it also signals bearish sentiment in the market. Beyond the RSI, momentum oscillators such as the Stochastic indicator and the Commodity Channel Index (CCI) are also painting a gloomy picture.
These tools are typically used to gauge market reversals and the strength of ongoing trends. In this case, both are tilting toward further downward momentum if no strong bullish catalyst appears, especially as prices struggle to hold above the $87 support level.
Short-Term Declines Contrast with Yearly Gains in LTC’s Moving AveragesThe analyst further highlighted a mixed outlook from Litecoin’s moving averages, suggesting a market caught between short-term weakness and long-term potential. In the near term, shorter-duration averages are flashing strong sell signals. These are driven by LTC’s recent negative performance, with a -9.0% drop over the past week and a -12.5% decline over the last two weeks, painting a clear picture of growing bearish momentum and sustained selling pressure.
However, the longer-term moving averages tell a different story. Despite recent setbacks, Litecoin has posted a 2.3% gain over the past year, which keeps the long-term trend technically bullish. This divergence suggests that while short-term traders may be responding to immediate price volatility and weakness, long-term investors could still see value in the asset, especially if broader market conditions stabilize or improve.
That said, the broader market sentiment currently leans bearish, weighed down by Litecoin’s inability to maintain key support levels amid recent price volatility. Even with long-term growth providing a degree of optimism, the prevailing trend is defined by downward pressure and uncertainty. Until short-term indicators begin to align with the long-term bullish structure, Litecoin may continue to face a challenging environment.
Why this matters
This cryptocurrency story adds another data point to the current market tape and is useful when read alongside nearby source coverage.
Original source
Read on NewsBTCRelated market context

XRP Price Prediction: FOMC Rate Hike Sparks Short Covering as XRP Reclaims $1.30 Support
The latest XRP move comes after the September 16 FOMC meeting, where the Federal Reserve raised its benchmark interest rate by 25...

Bitcoin (BTC) Price Prediction: Will FOMC Volatility Break Bitcoin Out of Its $76K Standoff?
The Bitcoin price has pulled back sharply from its recent highs while the upcoming FOMC decision could introduce a fresh volatilit...

Bitcoin (BTC) Price Today: SOPR Turns Bullish as BTC Holds $81K, Eyes $83K-$86K Short Squeeze
Bitcoin price and market data show BTC trading around $81,300 at the latest update, with a 24-hour range between $77,968 and $81,6...
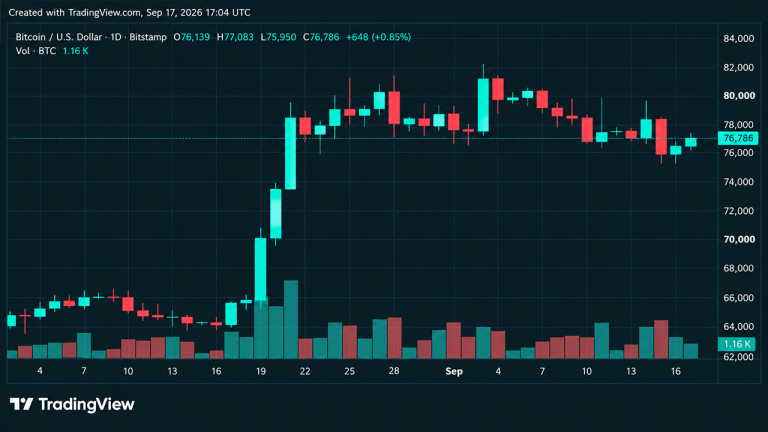
Crypto Liquidations Surge Past $260M as Bitcoin’s Price Touches $77K
Bitcoin’s price snapped its recent downward trend, briefly touching $77,000 before settling around $76,600. Despite sharp swings a...

Zoomex Highlights Key ETF Market Trends Ahead of This Week’s Federal Reserve Decision
VICTORIA, Seychelles, September 16, 2026 Global markets are entering a high volatility stretch. With a Federal Reserve rate decisi...

XRP News: 16-Cross History Complicates the Golden Cross Signal
XRP should be in every news headline as its 50-day moving average sits about 2% below its 200-day average, the closest the gap has...