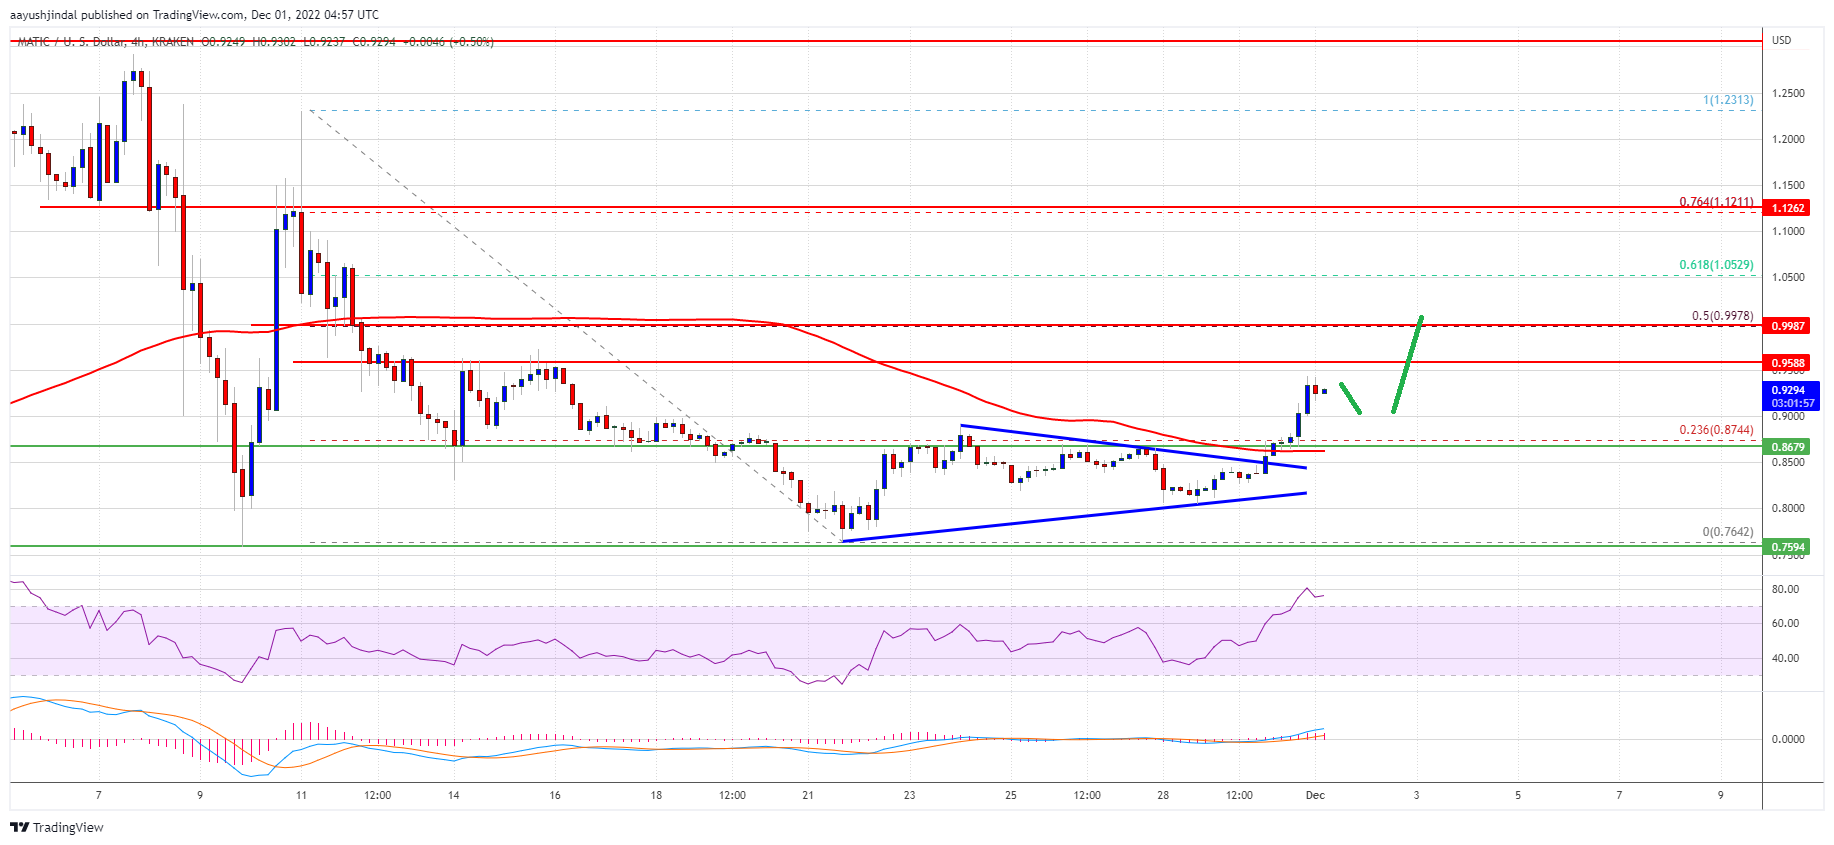
MATIC Price Prediction: Bulls Aim Fresh Rally To $1.12
MATIC price started a fresh increase from the $0.765 support zone. Polygon bulls are now aiming a fresh increase above the $1.00 resistance zone. MATIC price started a decent increase above the $0.90 resistance against t...

MATIC price started a fresh increase from the $0.765 support zone. Polygon bulls are now aiming a fresh increase above the $1.00 resistance zone.
- MATIC price started a decent increase above the $0.90 resistance against the US dollar.
- The price is trading above $0.90 and the 100 simple moving average (4-hours).
- There was a break above a key contracting triangle with resistance at $0.850 on the 4-hours chart of the MATIC/USD pair (data source from Kraken).
- The pair could continue to rise towards the $1.00 and $1.12 resistance levels.
This past month, polygon’s price declined below the $1.0 support zone. MATIC even broke the $0.85 support zone and the 100 simple moving average (4-hours).
However, the bulls were active near the $0.765 support zone. A low was formed near $0.7642 and the price started a decent recovery wave. The price was able to clear the $0.80 and $0.85 resistance levels. There was a break above the 23.6% Fib retracement level of the main drop from the $1.231 swing high to $0.764 low.
Besides, there was a break above a key contracting triangle with resistance at $0.850 on the 4-hours chart of the MATIC/USD pair. The pair is now trading above $0.90 and the 100 simple moving average (4-hours).
It gained over 5% today, outperforming bitcoin and ethereum. On the upside, an immediate resistance is near the $0.9580 level. The first major resistance is forming near the $1.00 zone. It is near the 50% Fib retracement level of the main drop from the $1.231 swing high to $0.764 low.
Source: MATICUSD on TradingView.com
If there is an upside break above the $0.98 and $1.00 resistance levels, the price could start another strong increase. In the stated case, the price could rise steadily towards the $1.12 level.
Dips Limited in MATIC?If MATIC price rise above the $0.958 and $1.00 resistance levels, it could start a downside correction. An immediate support on the downside is near the $0.90 level.
The main support is near the $0.850 level and the 100 simple moving average (4-hours). A downside break below the $0.850 level could open the doors for a fresh decline towards $0.80. The next major support is near the $0.725 level.
Technical Indicators
4-hours MACD – The MACD for MATIC/USD is gaining momentum in the bullish zone.
4-hours RSI (Relative Strength Index) – The RSI for MATIC/USD is now in the overbought zone.
Major Support Levels – $0.90 and $0.85.
Major Resistance Levels – $0.95, $0.98 and $1.00.
Original source
Read on NewsBTCRelated market context

Uranium Holds Above $85 as Mining ETF Rebounds From June Sell-Off
The latest charts display that the market is divided into stable physical prices and uranium shares trying to regain momentum afte...

Bitcoin price challenges $64,000 weekend wall – needing a breakout or risk a deeper correction
Bitcoin reclaimed $64,000 on June 12 and touched an intraday high of $64,301 in the same session that spot ETF flows finally flipp...

Bitcoin Mining Cost Model Points To $47,000 Floor, But Analysts Urge Caution
TL;DR Crypto Rover says Bitcoin has never bottomed below electrical production cost, currently estimated at $47,000. Mining-cost m...

Bitcoin rises above $64,000 after Pakistan prime minister says Iran peace deal is near
Bitcoin traded above $64,000 on Saturday, supported by its strongest ETF inflows in a month and growing optimism around geopolitic...

Standard Chartered Says Bitcoin Bottomed Near $59,000 As Crypto Winter Ends
TL;DR Standard Chartered’s Geoffrey Kendrick reportedly says Bitcoin’s $59,000 area marked the cycle bottom. The note cites SpaceX...

XRP Price Prediction: Japan XRP ETF Listing is Getting Closer
Japan just handed XRP bulls a major regulatory tailwind. XRP price is retesting a congestion zone, and the prediction could turn b...