MATIC Price Prediction: Can Polygon Rip Higher To $1.15
MATIC price is up over 5% and it tested the $0.950 resistance. Polygon bulls are in full control, and they might aim for more upsides above $1.00. MATIC price started a fresh increase above the $0.920 resistance against...

MATIC price is up over 5% and it tested the $0.950 resistance. Polygon bulls are in full control, and they might aim for more upsides above $1.00.
- MATIC price started a fresh increase above the $0.920 resistance against the US dollar.
- The price is trading above $0.925 and the 100 simple moving average (4 hours).
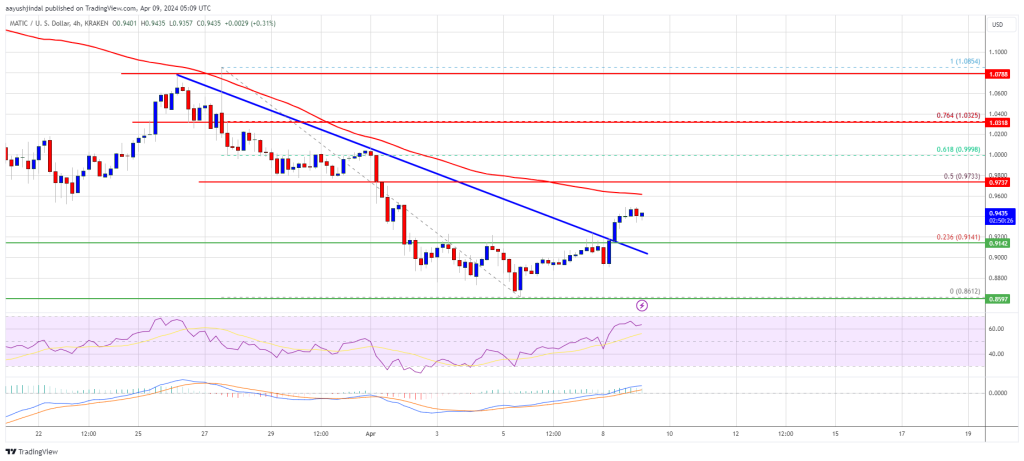
- There was a break above a key bearish trend line with resistance at $0.9150 on the 4-hour chart of the MATIC/USD pair (data source from Kraken).
- The pair could continue to move up if it clears the $0.9720 resistance.
After forming a base above the $0.8620 level, Polygon’s price started a fresh increase. MATIC cleared many hurdles near $0.880 and $0.8950 to move into a positive zone, like Bitcoin and Ethereum.
There was also a move above the $0.90 resistance and the 100 simple moving average (4 hours). The bulls pushed the price above the 23.6% Fib retracement level of the downward move from the $1.0854 swing high to the $0.8612 low.
Besides, there was a break above a key bearish trend line with resistance at $0.9150 on the 4-hour chart of the MATIC/USD pair. MATIC is trading above $0.9250 and the 100 simple moving average (4 hours).
Immediate resistance is near the $0.960 zone. The first major resistance is near the $0.9720 level or the 50% Fib retracement level of the downward move from the $1.0854 swing high to the $0.8612 low. If there is an upside break above the $0.9720 resistance level, the price could continue to rise.
Source: MATICUSD on TradingView.com
The next major resistance is near $1.00. A clear move above the $1.00 resistance could start a steady increase. In the stated case, the price could even attempt a move toward the $1.100 level or $1.150.
Are Dips Limited in MATIC?If MATIC’s price fails to rise above the $0.9720 resistance level, it could start a downside correction. Immediate support on the downside is near the $0.915 level and the same trend line.
The main support is near the $0.880 level. A downside break below the $0.880 level could open the doors for a fresh decline toward $0.8620. The next major support is near the $0.8250 level.
Technical Indicators
4 hours MACD – The MACD for MATIC/USD is gaining momentum in the bullish zone.
4 hours RSI (Relative Strength Index) – The RSI for MATIC/USD is now above the 50 level.
Major Support Levels – $0.9150 and $0.880.
Major Resistance Levels – $0.9720, $1.00, and $1.15.
Original source
Read on NewsBTCRelated market context

BTC News Today: Bitcoin Climbs Toward $66K as Trump Reveals US-Iran Peace Deal
The renewed geopolitical optimism helped improve risk sentiment across financial markets, pushing Bitcoin back toward the $66,000...

Bitcoin Stabilizes Near Key Zone, But Glassnode Warns Capital Flows Remain Weak
Bitcoin’s rebound from the $60,000 area has given bulls something to work with, but Glassnode’s latest market read suggests the re...

Ethereum Research Proposal Targets Post-Quantum Wallet Security At Low Gas Cost
A new Ethereum Research proposal is putting post-quantum wallet security back in focus, outlining a practical way to verify quantu...

Bitcoin Price and Crypto Stocks Surge as Iran Ceasefire, Strategy’s $100M Buy Collide With Fed Week
Bitcoin Magazine Bitcoin Price and Crypto Stocks Surge as Iran Ceasefire, Strategy’s $100M Buy Collide With Fed Week Bitcoin price...
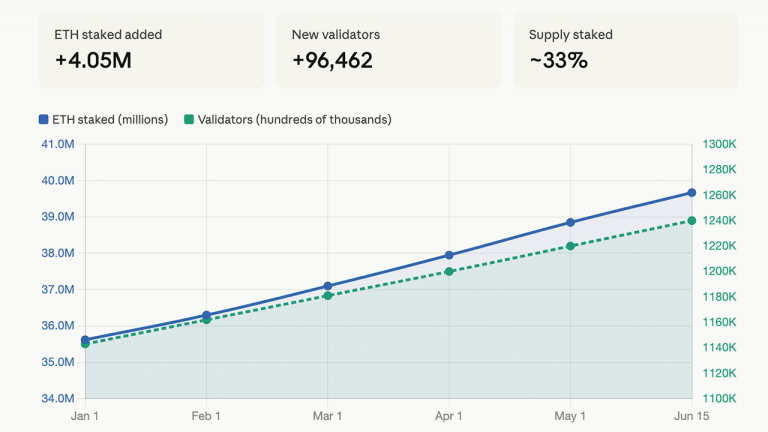
Ethereum Staking Nears 40M ETH Locked as 96,000 New Validators Join in 2026
Ethereum’s proof-of- stake network absorbed more than 4 million additional ETH in the first half of 2026, pushing total staked sup...

XRP Price Analysis: Ripple Token Eyes 10% Gain with Flashing Bullish Pattern and ETF Inflows
XRP price posts 9% moves today from low $1.1 to $1.24, with a prediction that it could go even higher. Two independent tailwinds a...