MATIC Price Prediction: Polygon Could Blast 10% To $0.70
MATIC price is consolidating gains above the $0.58 support zone. Polygon might gain bullish momentum if it clears the $0.650 resistance zone. MATIC price is showing positive signs below the $0.65 resistance against the U...

MATIC price is consolidating gains above the $0.58 support zone. Polygon might gain bullish momentum if it clears the $0.650 resistance zone.
- MATIC price is showing positive signs below the $0.65 resistance against the US dollar.
- The price is trading above $0.60 and the 100 simple moving average (4 hours).
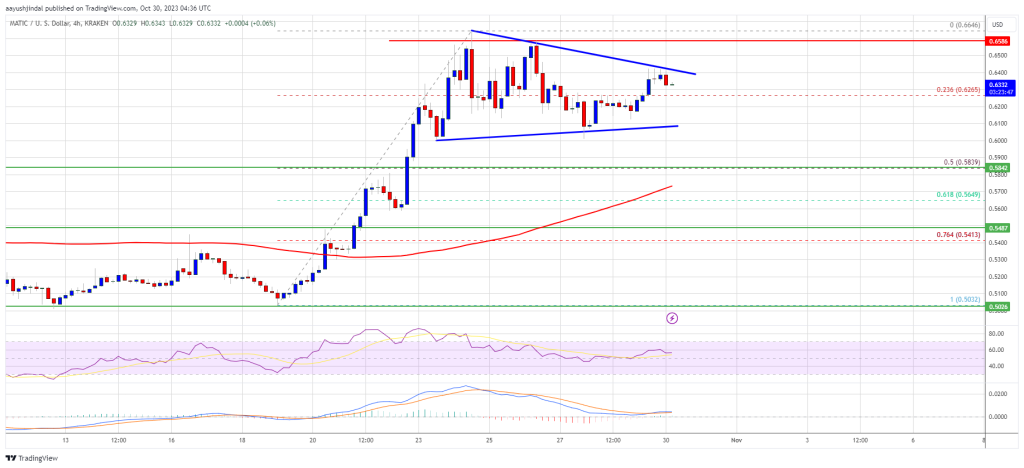
- There is a key contracting triangle forming with resistance near $0.640 on the 4-hour chart of the MATIC/USD pair (data source from Kraken).
- The pair could continue to rise if it clears the $0.640 and $0.650 resistance levels.
After forming a base above the $0.50 level, Polygon’s price started a steady increase. MATIC broke many hurdles near $0.550 to move into a positive zone, like Bitcoin and Ethereum.
There was a move above the $0.60 resistance and the price climbed as high as $0.6646. Recently, there was a minor downside correction below the $0.640 level. The price declined below the 23.6% Fib retracement level of the upward move from the $0.5032 swing low to the $0.6646 high.
MATIC is now trading above $0.60 and the 100 simple moving average (4 hours). There is also a key contracting triangle forming with resistance near $0.640 on the 4-hour chart of the MATIC/USD pair.
Source: MATICUSD on TradingView.com
Immediate resistance is near the $0.640 level. The first major resistance is near the $0.650 level. If there is an upside break above the $0.650 resistance level, the price could continue to rise. The next major resistance is near $0.665. A clear move above the $0.665 resistance could start a steady increase. In the stated case, the price could even attempt a move toward the $0.680 level or $0.700.
Downside Correction in MATIC?If MATIC’s price fails to rise above the $0.640 resistance level, it could start a downside correction. Immediate support on the downside is near the $0.6100 level.
The main support is near the $0.584 level or the 50% Fib retracement level of the upward move from the $0.5032 swing low to the $0.6646 high. A downside break below the $0.584 level could open the doors for a fresh decline toward $0.550. The next major support is near the $0.532 level.
Technical Indicators
4 hours MACD – The MACD for MATIC/USD is gaining momentum in the bullish zone.
4 hours RSI (Relative Strength Index) – The RSI for MATIC/USD is now above the 50 level.
Major Support Levels – $0.610 and $0.584.
Major Resistance Levels – $0.640, $0.650, and $0.700.
Original source
Read on NewsBTCRelated market context

Uranium Holds Above $85 as Mining ETF Rebounds From June Sell-Off
The latest charts display that the market is divided into stable physical prices and uranium shares trying to regain momentum afte...

Standard Chartered Says Bitcoin Bottomed Near $59,000 As Crypto Winter Ends
TL;DR Standard Chartered’s Geoffrey Kendrick reportedly says Bitcoin’s $59,000 area marked the cycle bottom. The note cites SpaceX...

Bitcoin Mining Cost Model Points To $47,000 Floor, But Analysts Urge Caution
TL;DR Crypto Rover says Bitcoin has never bottomed below electrical production cost, currently estimated at $47,000. Mining-cost m...

Google Gemini AI Predicts Jaw-Dropping XRP Price For Next 90 Days
Google Gemini AI just put XRP back under the spotlight, predicting it is tightly wound for a major breakout toward $1.60 to $1.80...

Bitcoin price challenges $64,000 weekend wall – needing a breakout or risk a deeper correction
Bitcoin reclaimed $64,000 on June 12 and touched an intraday high of $64,301 in the same session that spot ETF flows finally flipp...

Elon Musk SpaceX AI Predicts Incredible Bitcoin Price For Next 30 Days
Here is the thing about capitulation calls. They only sound smart in hindsight. Right now, with Bitcoin price scraping along the l...