MATIC Price Prediction: Polygon Recovery Faces Many Hurdles
MATIC price is recovering from the $0.95 support zone. Polygon might rise further but there is a major barrier forming near the $1.080 zone. MATIC price is attempting a recovery wave above the $1.00 resistance against th...

MATIC price is recovering from the $0.95 support zone. Polygon might rise further but there is a major barrier forming near the $1.080 zone.
- MATIC price is attempting a recovery wave above the $1.00 resistance against the US dollar.
- The price is trading below $1.10 and the 100 simple moving average (4 hours).
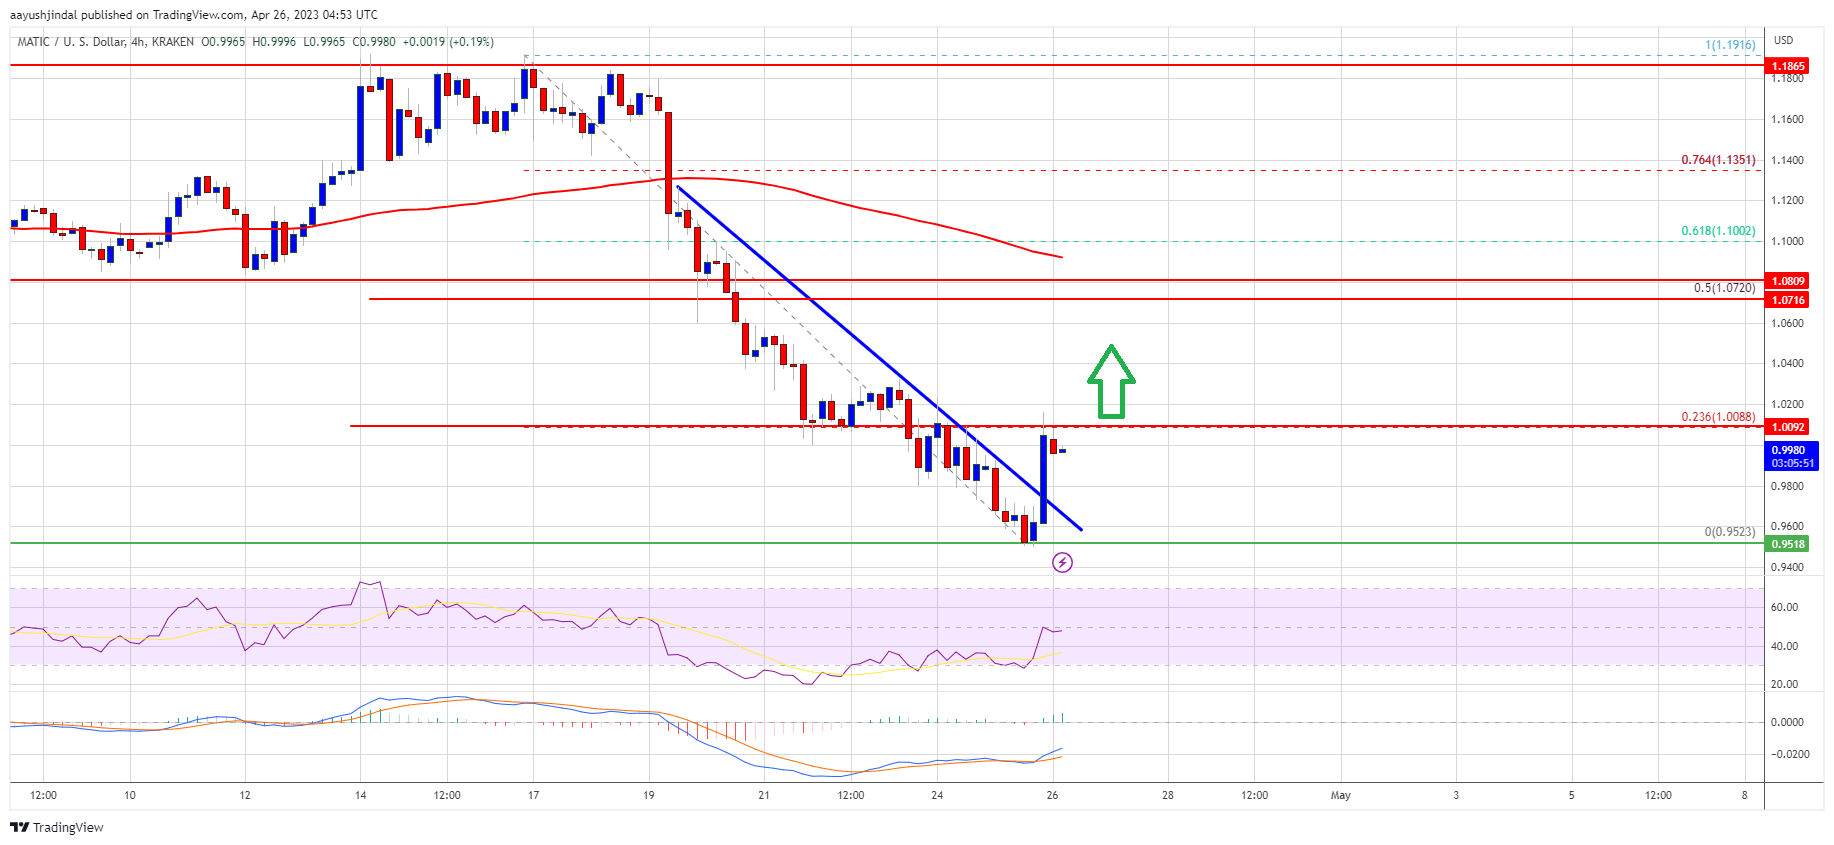
- There was a break above a key bearish trend line with resistance near $0.975 on the 4-hour chart of the MATIC/USD pair (data source from Kraken).
- The pair could continue to rise if it clears the $1.008 resistance zone.
In the past few days, Polygon’s price saw a steady decline from well above $1.12. MATIC declined below the $1.00 support to move into a bearish zone.
A low is formed near $0.952 and the price is now attempting a recovery wave, similar to Bitcoin and Ethereum. The price was able to climb above $0.980. Besides, there was a break above a key bearish trend line with resistance near $0.975 on the 4-hour chart of the MATIC/USD pair.
The price is still trading below $1.10 and the 100 simple moving average (4 hours). It is now facing resistance near the $1.008 level or the 23.6% Fib retracement level of the downward move from the $1.191 swing high to the $0.952 low.
If there is an upside break above the $1.008 resistance level, the price could continue to recover. The next major resistance is near $1.08 or the 50% Fib retracement level of the downward move from the $1.191 swing high to the $0.952 low.
Source: MATICUSD on TradingView.com
A clear move above the $1.08 resistance could start a steady increase. In the stated case, the price could even attempt a move toward the $1.15 level or $1.20.
More Losses in MATIC?If MATIC’s price fails to rise above the $1.008 resistance level, it could start a fresh decline. Immediate support on the downside is near the $0.98 level.
The main support is near the $0.95 level. A downside break below the $0.95 level could open the doors for a fresh decline toward $0.88. The next major support is near the $0.82 level.
Technical Indicators
4 hours MACD – The MACD for MATIC/USD is gaining momentum in the bullish zone.
4 hours RSI (Relative Strength Index) – The RSI for MATIC/USD is now near the 50 level.
Major Support Levels – $0.98 and $0.95.
Major Resistance Levels – $1.008, $1.08, and $1.12.
Original source
Read on NewsBTCRelated market context

Uranium Holds Above $85 as Mining ETF Rebounds From June Sell-Off
The latest charts display that the market is divided into stable physical prices and uranium shares trying to regain momentum afte...

Standard Chartered Says Bitcoin Bottomed Near $59,000 As Crypto Winter Ends
TL;DR Standard Chartered’s Geoffrey Kendrick reportedly says Bitcoin’s $59,000 area marked the cycle bottom. The note cites SpaceX...

Bitcoin price challenges $64,000 weekend wall – needing a breakout or risk a deeper correction
Bitcoin reclaimed $64,000 on June 12 and touched an intraday high of $64,301 in the same session that spot ETF flows finally flipp...

Bitcoin Mining Cost Model Points To $47,000 Floor, But Analysts Urge Caution
TL;DR Crypto Rover says Bitcoin has never bottomed below electrical production cost, currently estimated at $47,000. Mining-cost m...

Are 24/7 CME Bitcoin futures a volatility cure — or a new leverage trap?
Wall Street got to trade Bitcoin around the clock just in time to watch the market fall apart. CME Group launched 24/7 trading for...

Google Gemini AI Predicts Jaw-Dropping XRP Price For Next 90 Days
Google Gemini AI just put XRP back under the spotlight, predicting it is tightly wound for a major breakout toward $1.60 to $1.80...