Polkadot (DOT) Forms Rising Wedge Pattern, Bullish Or Bearish?
Polkadot (DOT), a popular cryptocurrency in the blockchain space, has been making waves with its innovative approach to interoperability and scalability. However, like any financial asset, its price movement is subject t...
Archive context
Older archive item. Useful for background and entity history, but not a fresh market-moving signal.

Polkadot (DOT), a popular cryptocurrency in the blockchain space, has been making waves with its innovative approach to interoperability and scalability. However, like any financial asset, its price movement is subject to various technical analysis patterns, one of which is the rising wedge chart pattern.
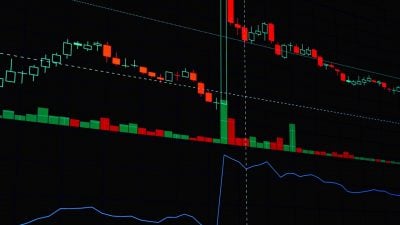
The formation of a rising wedge pattern on DOT’s price chart suggests that despite its recent upward trajectory, there could be a downturn on the horizon. Traders and investors often watch for confirmation signals such as a break below the lower base of the wedge to confirm the pattern’s validity and anticipate potential selling pressure.
Currently, the price of DOT is down by -0.13%, trading at about $7.13, with a market capitalization of over $10 billion and a trading volume of over $153 Million as of the time of writing. Although its market capitalization is down by 0.39%, its trading volume is up by 0.34% in the past day.
With the help of the 100-day Simple Moving Average (SMA), and Relative Strength Index (RSI), this analysis was carried out using both the 4-hour and daily timeframe.
Analytical View Of DOT’s Current Price ConditionCurrently, in the 4-hour chart, DOT is still moving in a consolidation manner, with the upper base and the lower base of the wedge building up momentum below the 100-day simple moving average.
The 4-hour relative strength index is signaling that the price of DOT might break below the lower base of the wedge as the RSI line is seen trending a bit below the 50% level. From this RSI formation, it can be suggested that if DOT breaks below the wedge, it will begin to move downward toward the closest key support level.
Meanwhile, in the 1-day chart, DOT’s price is seen trending within the wedge but close to the lower base. The 1-day RSI also suggests that DOT might go bearish as the RSI line is attempting to cross below the 50% level. From this RSI formation, it is advised that investors should watch out for a break below the wedge before taking any sell positions.
Potential Price Action In The Event Of A BreakoutPresently, the crypto asset’s price is still moving within the wedge, and DOT will begin to decline in the direction of the $4.8 support level in the event that there is a breakout below the wedge. If the price falls below the aforementioned level, it might perhaps fall further to test the $3.5 support level.
On the other hand, if the price reverses course and breaks above the wedge’s upper base, it will begin to rise toward the $9,8 resistance level. Should it break above this level, Polkadot will go higher to test the $11.9 resistance level. In addition, DOT might see a stronger rise to test more significant levels if it closes above $11.9.
Why this matters
This cryptocurrency story adds another data point to the current market tape and is useful when read alongside nearby source coverage.
Original source
Read on NewsBTCRelated market context
Coinbase will support the AERO and VELO token migration from November 2 to 4, 2026
The token migration could streamline DeFi operations, enhancing liquidity and governance across multiple blockchain networks. The...

Zcash (ZEC) Price Prediction: Whale Accumulation and ETF Outflows Put ZEC at a Critical Crossroads Around $1,400
The Zcash price reached a September high near $1,687 before retreating toward the $1,400 area. Historical price data shows the tok...

Bitcoin (BTC) Price Today: 2028 Halving Cycle and BlackRock ETF Inflow Signal Long-Term Rally
Recent market data also show that Bitcoin buyers have absorbed a key sell wall around $85,000, reducing one source of near-term re...

PropAMMs lower Solana trade costs, and public pool returns crash
A trader can get a better Solana (SOL) swap price while a passive pool depositor remains exposed to traders picking off stale quot...

Base Cobalt Goes Live With Conditional Trades and New B20 Controls for Tokenized Assets
Key Takeaways: The newest Cobalt upgrade by Base has been activated on the mainnet. Traders can send orders which will only be fil...

XRP Price, $300M ETF Demand, and 45% Q3 Supply Overhang
XRP price rose more than 45% in Q3 as U.S. spot XRP ETFs attracted about $307.9 million, yet the token entered October near $1.50...