Polkadot Price Lags: Can DOT Establish a Base for Recovery?
Polkadot (DOT) is struggling below $5.00 against the US Dollar. The price must settle above the $4.35 and $4.50 resistance levels to start a decent increase. DOT declined steadily below the $5.50 and $5.00 levels against...

Polkadot (DOT) is struggling below $5.00 against the US Dollar. The price must settle above the $4.35 and $4.50 resistance levels to start a decent increase.
- DOT declined steadily below the $5.50 and $5.00 levels against the US Dollar.
- The price is trading below the $5.00 zone and the 100-hourly simple moving average.
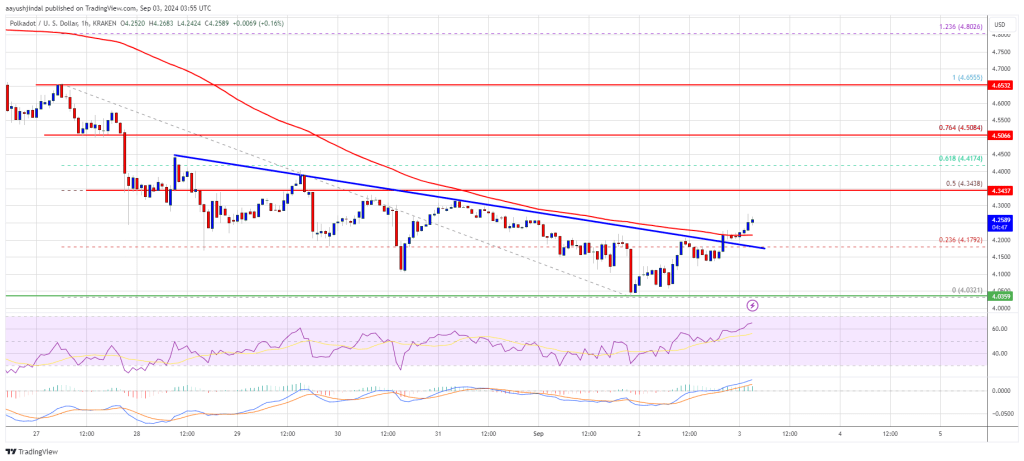
- There was a break above a connecting bearish trend line with resistance at $4.18 on the hourly chart of the DOT/USD pair (data source from Kraken).
- The pair could start a decent upward move if it settles above $4.35 and then $4.50.
In the past few weeks, DOT price saw a steady decline from well above $6.50. Bitcoin and Ethereum were stable, but Polkadot remained in the red zone. There was a close below the $5.00 level.
Finally, the price tested the $4.00 zone. A low was formed at $4.03 and the price recently started a recovery wave. There was a move above the $4.10 and $4.15 resistance levels. The price climbed above the 23.6% Fib retracement level of the downward move from the $4.65 swing high to the $4.03 low.
There was also a break above a connecting bearish trend line with resistance at $4.18 on the hourly chart of the DOT/USD pair. DOT is now trading below the $4.50 zone and the 100 simple moving average (4 hours).
Immediate resistance is near the $4.30 level. The next major resistance is near $4.35 or the 50% Fib retracement level of the downward move from the $4.65 swing high to the $4.03 low. A successful break above $4.35 could start another strong rally. In the stated case, the price could easily rally toward $4.50 in the near term. The next major resistance is seen near the $5.00 zone.
Another Decline in DOT?If DOT price fails to start a fresh increase above $4.35, it could start another decline. The first key support is near the $4.15 level.
The next major support is near the $4.10, below which the price might decline to $4.00. Any more losses may perhaps open the doors for a move toward the $3.85 support zone or $3.60.
Technical Indicators
Hourly MACD – The MACD for DOT/USD is now gaining momentum in the bullish zone.
Hourly RSI (Relative Strength Index) – The RSI for DOT/USD is now above the 50 level.
Major Support Levels – $4.15 and $4.00.
Major Resistance Levels – $4.35 and $4.50.
Original source
Read on NewsBTCRelated market context

Uranium Holds Above $85 as Mining ETF Rebounds From June Sell-Off
The latest charts display that the market is divided into stable physical prices and uranium shares trying to regain momentum afte...

Bitcoin price challenges $64,000 weekend wall – needing a breakout or risk a deeper correction
Bitcoin reclaimed $64,000 on June 12 and touched an intraday high of $64,301 in the same session that spot ETF flows finally flipp...

Bitcoin faces one of its biggest mining difficulty drops as miner margins collapse
The Bitcoin network is poised to execute one of the largest downward adjustments to its mining difficulty in its 17-year history t...

Standard Chartered Says Bitcoin Bottomed Near $59,000 As Crypto Winter Ends
TL;DR Standard Chartered’s Geoffrey Kendrick reportedly says Bitcoin’s $59,000 area marked the cycle bottom. The note cites SpaceX...

US forces shoot down Iranian attack drones near Strait of Hormuz, Bitcoin drops below $73K
Geopolitical tensions near vital oil routes can destabilize financial markets, highlighting the interconnectedness of global secur...

Google Gemini AI Predicts Jaw-Dropping XRP Price For Next 90 Days
Google Gemini AI just put XRP back under the spotlight, predicting it is tightly wound for a major breakout toward $1.60 to $1.80...