Polkadot Price Sets Sights on New Highs: DOT Bullish Momentum Building
Polkadot (DOT) is consolidating gains above the $7.40 zone against the US Dollar. The price could start another increase if it clears the $7.70 resistance. DOT gained pace and tested the $7.70 resistance level against th...

Polkadot (DOT) is consolidating gains above the $7.40 zone against the US Dollar. The price could start another increase if it clears the $7.70 resistance.
- DOT gained pace and tested the $7.70 resistance level against the US Dollar.
- The price is trading above the $7.20 zone and the 100-hourly simple moving average.
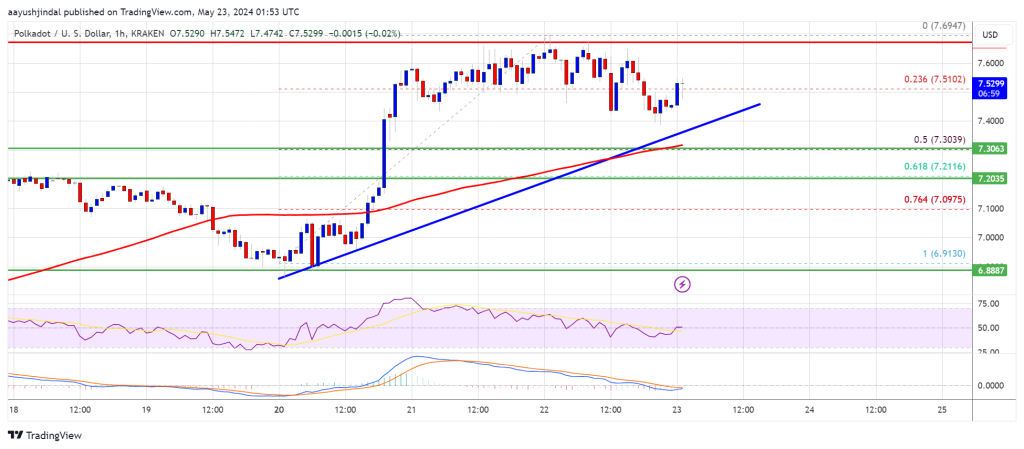
- There is a key bullish trend line forming with support at $7.40 on the hourly chart of the DOT/USD pair (data source from Kraken).
- The pair could continue to rise if it fails to stay above the $7.20 support.
After forming a base above the $6.80 level, DOT price started a decent increase. It broke many hurdles near $7.20 and even spiked above $7.65. A high was formed at $7.69 and the price is now consolidating gains, like Ethereum and Bitcoin.
There was a move below the $7.50 support zone. The price declined below the 23.6% Fib retracement level of the upward move from the $6.91 swing low to the $7.69 high.
DOT is now trading above the $7.20 zone and the 100 simple moving average (4 hours). There is also a key bullish trend line forming with support at $7.40 on the hourly chart of the DOT/USD pair. Immediate resistance is near the $7.70 level.
The next major resistance is near $7.80. A successful break above $7.80 could start another strong rally. In the stated case, the price could easily rally toward $8.20 in the near term. The next major resistance is seen near the $8.50 zone.
More Downsides in DOT?If DOT price fails to start a fresh increase above $7.70, it could continue to move down. The first key support is near the $7.40 level and the trend line.
The next major support is near the $7.30 and the 100 simple moving average (4 hours) or the 50% Fib retracement level of the upward move from the $6.91 swing low to the $7.69 high, below which the price might decline to $7.00. Any more losses may perhaps open the doors for a move toward the $6.90 support zone or $6.80.
Technical Indicators
Hourly MACD – The MACD for DOT/USD is now gaining momentum in the bullish zone.
Hourly RSI (Relative Strength Index) – The RSI for DOT/USD is now above the 50 level.
Major Support Levels – $7.40, $7.30 and $7.10.
Major Resistance Levels – $7.70, $7.80, and $8.20.
Original source
Read on NewsBTCRelated market context

Standard Chartered Says Bitcoin Bottomed Near $59,000 As Crypto Winter Ends
TL;DR Standard Chartered’s Geoffrey Kendrick reportedly says Bitcoin’s $59,000 area marked the cycle bottom. The note cites SpaceX...

Google Gemini AI Predicts Jaw-Dropping XRP Price For Next 90 Days
Google Gemini AI just put XRP back under the spotlight, predicting it is tightly wound for a major breakout toward $1.60 to $1.80...

Bitcoin price challenges $64,000 weekend wall – needing a breakout or risk a deeper correction
Bitcoin reclaimed $64,000 on June 12 and touched an intraday high of $64,301 in the same session that spot ETF flows finally flipp...

Bitcoin rises above $64,000 after Pakistan prime minister says Iran peace deal is near
Bitcoin traded above $64,000 on Saturday, supported by its strongest ETF inflows in a month and growing optimism around geopolitic...

Elon Musk SpaceX AI Predicts Incredible Bitcoin Price For Next 30 Days
Here is the thing about capitulation calls. They only sound smart in hindsight. Right now, with Bitcoin price scraping along the l...

Bitcoin Mining Cost Model Points To $47,000 Floor, But Analysts Urge Caution
TL;DR Crypto Rover says Bitcoin has never bottomed below electrical production cost, currently estimated at $47,000. Mining-cost m...