Polkadot Under Strong Bearish Influence , Will The Nearest Support Level Hold?
Polkadot continues to face downtrend on its chart as broader market strength also remained low. Over the last 24 hours, DOT lost close to 8% of its market value invalidating weekly gains that DOT secured. Technical outlo...
Archive context
Older archive item. Useful for background and entity history, but not a fresh market-moving signal.

Polkadot continues to face downtrend on its chart as broader market strength also remained low. Over the last 24 hours, DOT lost close to 8% of its market value invalidating weekly gains that DOT secured. Technical outlook for the coin indicated bearish price action.
In accordance with the same, it is likely that the coin might not be able to hold itself above the $6 support level. The coin has been witnessing stiff resistance at the $7.20 mark. Only if the coin manages to trade above $7.20 for a considerable period of time, the bulls could be back.
On the developmental front, Polkadot is introducing a new on chain governance model. Gavin Wood, Polkadot founder announced about the on chain governance model as a part of the Polkadot Decoded 2022 conference.
The primary goal of this new governance model is to ramp up the number of collective decisions the governance structure is able to make. The newest development is yet to have any positive effect on the price of the altcoin.
Polkadot Price Analysis: One Day Chart Polkadot was priced at $6.70 on the one day chart | Source: DOTUSD on TradingViewDOT was trading at $6.76 at the time of writing. The nearest support line for the coin is at $6. The sellers have taken over so the coin can soon slip below the aforementioned price level.
Fall below the $6 support level will make DOT hit a new low this year, the coin might trade near the $4.20 support line. Overhead resistance stood at $7.20, the coin has struggled to move past that level over the last few days.
If DOT registers a price correction and manages to move past the $7.20 level then DOT could manage to touch the $8.70 resistance mark. Volume of DOT traded fell significantly indicating bearishness on the chart.
Technical Analysis Polkadot depicted low buying strength on the one day chart | Source: DOTUSD on TradingViewBuyers have exited the market as DOT turned substantially bearish over the last few days. Buying strength continued to remain choppy, despite the buying strength showing recovery, as price slipped so did the buying strength.
The Relative Strength Index was beneath the half-line suggesting that sellers outnumbered buyers and that price would continue on a downtrend. On the 20-SMA, the coin was below the 20-SMA line which suggested that sellers had taken over the price momentum in the market.
Related Reading | Ethereum Keeps Sliding Down, Will The Support Line of $1,100 Break?
Polkadot displayed sell signal on the one day chart | Source: DOTUSD on TradingViewIn accordance to the increased selling pressure, the coin had flashed sell signals on the chart. Awesome Oscillator is responsible for depicting price trends and reversals in the same. The indicator formed red signal bars which are tied to sell signal for the coin.
Bollinger Bands portray the price volatility in the market. Bollinger Bands were heavily narrowed which meant that there would be an explosive price action over the next trading sessions. Going by the technical outlook, it could be possible that the coin might break the support level and trade at a new low.
Related Reading | Bitcoin Records Worst Performance For June, Will It Get Better From Here?
Featured image from Currency.com, chart from TradingView.comWhy this matters
This cryptocurrency story adds another data point to the current market tape and is useful when read alongside nearby source coverage.
Original source
Read on NewsBTCRelated market context

Elon Musk’s Grok AI Predicts an Insane Bitcoin Price for 2027
Something potentially historic could happen to Bitcoin by January 1, 2027. Elon Musk’s Grok AI predicts that in an intentionally e...
$6 billion Binance hack sends bitcoin, ether tumbling; Standard Chartered expects more pain
Bitcoin and ether slid after a suspected $6.3 billion Binance security breach and a Polymarket exploit. Standard Chartered says cr...

Copilot AI Predicts PI Network Binance Price
Something potentially explosive could be building for Pi Network (PI) by January 1, 2027. Microsoft Copilot AI predicts that a spe...

Strategy Sold 5,552 Bitcoin and Bought 7,218 in Q3 as a $20.9 Billion Markup Drove Profit
Strategy reported $20.91 billion of operating income for the third quarter on Thursday, all of it from a $20.91 billion gain on di...
Coinbase Says Customer Funds Safe After Analytics Vendor Contact-Data Incident
TL;DR: Coinbase said an incident involving analytics provider Amplitude affected contact information associated with a small subse...
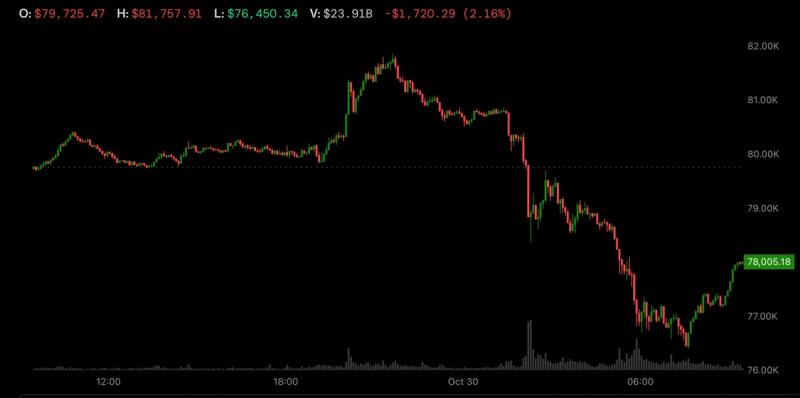
Bitcoin Slips Below $80,000 After Fed Holds Rates and Tech Shares Weaken
TL;DR: Bitcoin slipped below $80,000 in early October 29 trading as markets digested the Federal Reserve’s decision to leave rates...