Polygon Price Could Aim For These Levels Before The Bulls Wane Off
Polygon price (MATIC) has retraced on its chart as the broader market depicted weakness. Over the last 24 hours, however, the coin has managed to move up by 0.2%. In the last week, MATIC rallied by over 14%, pushing pric...
Archive context
Older archive item. Useful for background and entity history, but not a fresh market-moving signal.

Polygon price (MATIC) has retraced on its chart as the broader market depicted weakness. Over the last 24 hours, however, the coin has managed to move up by 0.2%.
In the last week, MATIC rallied by over 14%, pushing prices to break past multiple price ceilings. The altcoin is trading sideways on the one-day chart, but the coin is still optimistic.
The technical outlook of the coin has continued to side with the bulls as demand for the altcoin noted an uptick over the past day.
Buying strength also signified an increase, but this reading could be momentary as the bulls could lose steam if demand doesn’t remain consistent.
Polygon price can eye its immediate resistance mark before the bullish steam finally wanes off. With Bitcoin slipping down on its chart, many altcoins have travelled south on their respective charts.
Polygon is still among those altcoins that have displayed the presence of bulls on their chart. It is crucial for Polygon price to trade above the $0.96 mark if it has to maintain its positive price momentum.
Polygon Price Analysis: One-Day Chart Polygon was priced at $0.92 on the one-day chart | Source: MATICUSD on TradingViewMATIC was trading at $0.92 at the time of writing.
The altcoin has been moving sideways on its one-day chart. Polygon price has made a good recovery in the past week.
However, it is important for the coin to move above its overhead resistance in order for the bulls to regain momentum.
Immediate resistance for MATIC was at $0.96 and, moving past that, the coin could witness another resistance at $0.97 before it touches $1.
If buying momentum fades, the support line for Polygon awaits at $0.86 and then straight to $0.80.
The amount of MATIC traded in the last session noted an increase, signifying that the demand for the coin has climbed up.
Technical Analysis Polygon registered an uptick in buying strength on the one-day chart | Source: MATICUSD on TradingViewThe buying strength for Polygon registered growth again, showing signs of revival as the demand for the coin fell over the last trading sessions.
This increase in the number of buyers could push Polygon price to trade near its immediate resistance mark.
The Relative Strength Index was positive and it moved above the 60-mark, indicating that buyers still outnumbered sellers substantially.
Polygon price was above the 20-SMA line, signalling that demand for the altcoin surged and that buyers have continued to drive the price momentum in the market.
Polygon showed buy signal on the one-day chart | Source: MATICUSD on TradingViewThe other technical indicators of Polygon have pointed out that the bulls are still in control. Although the strength of the bulls has wavered, the chart was still optimistic.
Moving Average Convergence Divergence indicates the price momentum and the strength of the direction.
MACD approved the bulls as it displayed green histograms, which were the buy signal for the altcoin. The Parabolic SAR also points to the strength of the price action.
The dotted lines were below the price candlesticks, which meant that MATIC could experience an uptrend over the next trading sessions.
Featured Image From Mt Pelerin, Charts From TradingViewWhy this matters
This cryptocurrency story adds another data point to the current market tape and is useful when read alongside nearby source coverage.
Original source
Read on NewsBTCRelated market context

Bitcoin (BTC) Price Prediction: $74K Liquidity Gap Puts $80K Support to the Test
Meanwhile, data from Glassnode and Fasanara Digital show that traditional financial assets are capturing a growing share of deriva...
Bitcoin’s Fed Week Starts With A Fresh Rise In US Inflation Expectations
TL;DR: US household inflation expectations rose in October while consumer sentiment barely changed. The readings add context ahead...
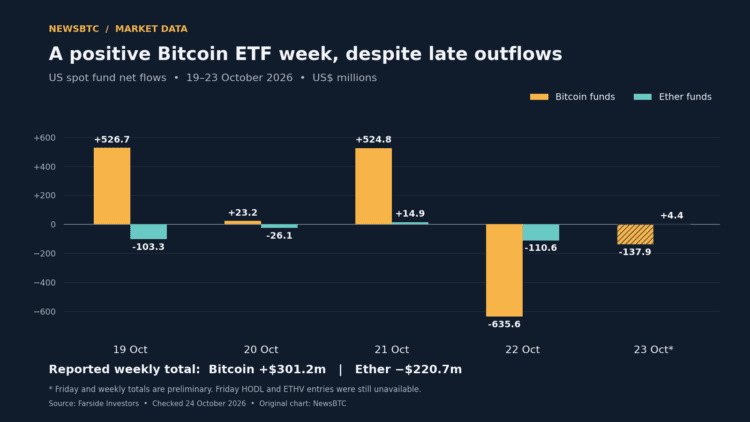
Bitcoin ETF Week Stays Positive After Nearly $774 Million In Late Outflows
TL;DR: Farside’s preliminary figures show US Bitcoin funds retaining a $301.2 million weekly inflow despite two days of withdrawal...
Circle Gateway Adds Bitcoin And Euro Balances With cirBTC And EURC
Circle is taking its cross-chain balance service beyond USDC. The company announced on October 23 that Gateway now supports its wr...
Bitcoin Hashrate Reclaims One Zettahash As Mining Competition Rebounds
TL;DR: BlocksBridge reported Bitcoin’s seven-day hashrate above one zettahash in the week to October 22. Mining competition has re...
Franklin Moves Bitcoin DRIP ETFs Toward Nasdaq With Dividend Reinvestment Plan
TL;DR: Franklin Templeton has filed exchange registrations for two stock-and-Bitcoin ETFs. Their strategy redirects equity dividen...