POPCAT Surges Past $1.0094 All-Time High – What’s The Next Price Target?
POPCAT has achieved a remarkable milestone by surging past its all-time high of $1.0094, igniting excitement among traders and investors alike. This breakout signals a powerful bullish momentum, prompting a re-evaluation...
Archive context
Older archive item. Useful for background and entity history, but not a fresh market-moving signal.

POPCAT has achieved a remarkable milestone by surging past its all-time high of $1.0094, igniting excitement among traders and investors alike. This breakout signals a powerful bullish momentum, prompting a re-evaluation of the asset’s potential for further gains. As the market reacts to this significant price movement, understanding the underlying technical factors and market dynamics is crucial for forecasting future price action.
In this technical breakdown, we will analyze the recent surge of POPCAT past its previous all-time high of $1.0094, focusing on the technical indicators and market conditions that have contributed to this breakout. By examining key support and resistance levels, as well as the potential for a continued bullish trajectory, we will assess the implications of this price action for traders and investors.
Additionally, the article will explore potential scenarios for POPCAT’s price movement, providing insights into what to expect in the coming days and how market sentiment may influence future trends.
Analyzing Technical Indicators After New PeakOn the 4-hour chart, POPCAT has demonstrated impressive bullish momentum, breaking above both the 100-day Simple Moving Average (SMA) and its previous all-time high of $1.0094. Reaching a new all-time high marks a critical milestone for the meme coin, as it validates the positive trend and opens the door for potential new highs.
An analysis of the 4-hour Relative Strength Index (RSI) reveals a renewed upward potential, as the RSI has climbed back to 68% after dipping to 45%. This upward shift indicates increasing buying pressure. If the RSI continues on this trajectory, it could signal more upside movements for POPCAT, paving the way for new highs, and reinforcing the bullish trend.
Furthermore, the meme coin has fully positioned itself above the daily 100-day SMA, indicating a strong positive pressure after surpassing its all-time high of $1.0094. As the price breaks through previous resistance levels, it attracts more buyers, enhancing the likelihood of a sustained uptick and fortifying the overall optimistic outlook for POPCAT in the near term.
Also, the RSI on the daily chart is currently at 74%, having previously dropped to 59%. An elevated RSI level implies that POPCAT is in overbought territory, reflecting strong buying pressure and heightened enthusiasm in the market. While such high readings may signal potential exhaustion in upbeat momentum, the lack of immediate indications for a pullback shows that bullish sentiment remains strong.
Support And Resistance Levels: Navigating The New Terrain For POPCATSupport Levels: The immediate support level to watch is the $1.0094 mark, which may act as a psychological level for buyers. Should it fall below this range, the next significant support could be found around the $0.80 mark, serving as a strong base for possible rebounds.
Resistance Levels: On the upside, the next resistance level can be anticipated at around $1.5, where sellers may emerge to take profits. If POPCAT manages to breach this level, it could lay the foundation for further gains, potentially targeting $2 and beyond.
Why this matters
This cryptocurrency story adds another data point to the current market tape and is useful when read alongside nearby source coverage.
Original source
Read on NewsBTCRelated market context
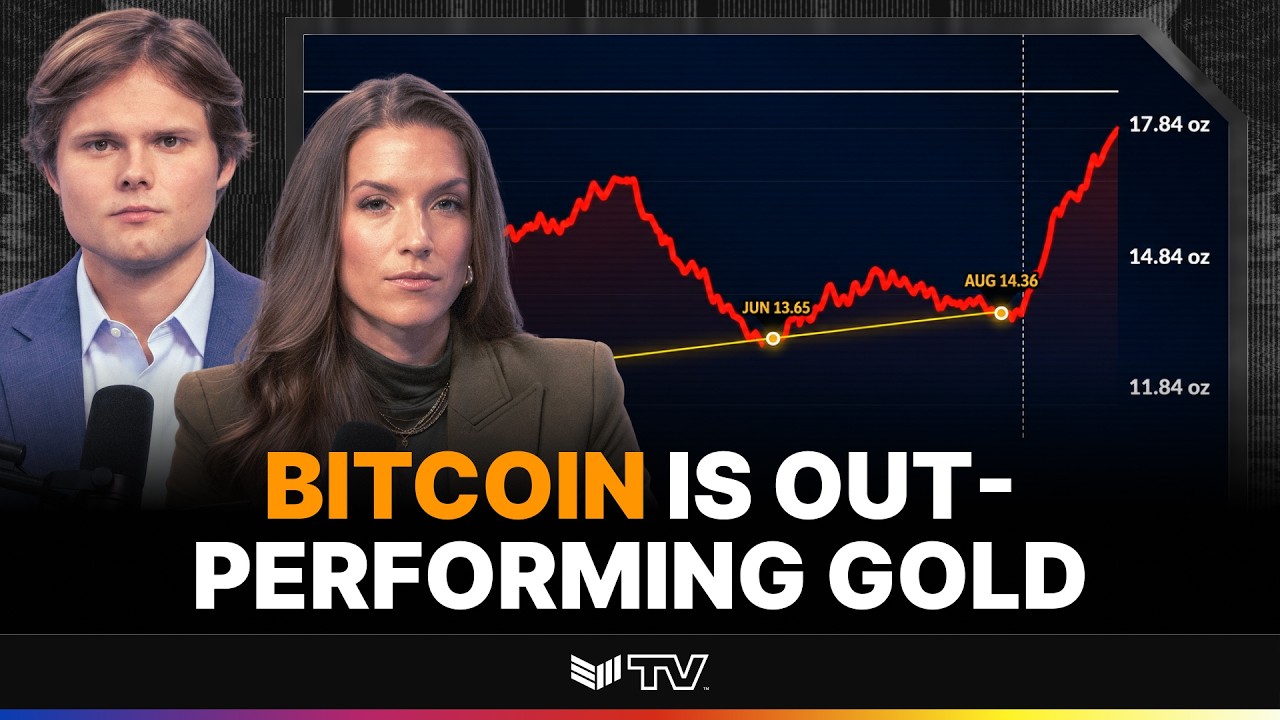
TECHNICAL ANALYSIS: BTC to Cross Key Price Level Against Gold
Bitcoin Magazine TECHNICAL ANALYSIS: BTC to Cross Key Price Level Against Gold The 90-day correlation between Bitcoin and gold jus...

Elon Musk Grok AI Predicts a Bold Move for Ethereum in 2026
When prompted, the Elon Musk-backed Grok AI predicts a bold move for Ethereum (ETH) over the remainder of 2026. It claims that if...

Bitcoin (BTC) Price Today: BTC Holds Uptrend as $84K FVG Shapes Intraday Setup
The setup comes as on-chain data shows that profit-taking remains relatively contained despite the latest Bitcoin price recovery....

Ripple CEO Brad Garlinghouse Says XRP and Solana Can Both Thrive in Crypto’s Next 5 Years
Garlinghouse’s comments have resurfaced as XRP and Solana both trade near important technical levels following recent gains. “I’m...

Katie Stockton: $93K BTC is the Key Price Level for the Bull Market
Bitcoin Magazine Katie Stockton: $93K BTC is the Key Price Level for the Bull Market Is the Bitcoin bear market officially over? K...
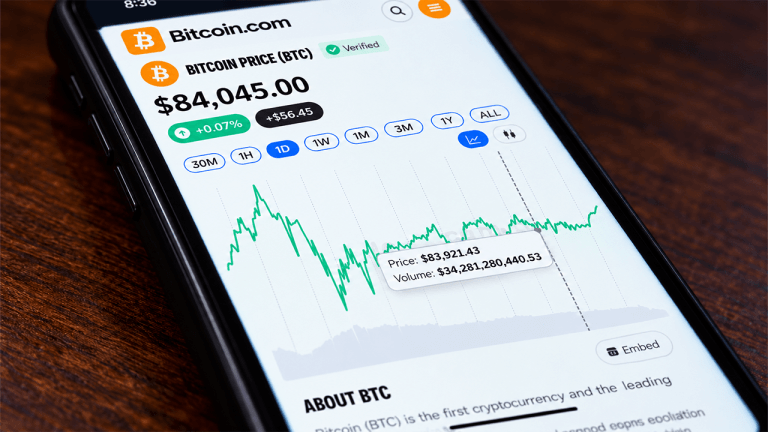
Bitcoin Price Still 33% Below Its Peak High as Bulls Plot a Comeback
At 8:30 a.m. Eastern time, bitcoin’s price stood at $84,162 on Saturday, Sept. 26, 2026, down 0.51% over 24 hours, as the leading...