Shiba Inu Breakout Eyes $0.00002631 Level After Rallying Over 19%
Shiba Inu is experiencing a notable price breakout, surging over 19% and positioning itself toward the critical resistance level of $0.00002631. This significant rally indicates a shift in market momentum, characterized...
Archive context
Older archive item. Useful for background and entity history, but not a fresh market-moving signal.

Shiba Inu is experiencing a notable price breakout, surging over 19% and positioning itself toward the critical resistance level of $0.00002631. This significant rally indicates a shift in market momentum, characterized by robust buying pressure and increased trading volume. Technical indicators suggest that SHIB is establishing a bullish trend, with key support levels solidifying its upward trajectory.
As Shiba Inu approaches this pivotal resistance zone, we will navigate its recent 19% breakout and its approach toward the critical resistance level of $0.00002631. By examining the underlying technical indicators, market sentiment, and key support levels, we will assess the strength of SHIB’s upward trajectory and explore whether this rally can sustain its upward trajectory in the face of market resistance.
Bullish Momentum Builds As Shiba Inu Targets Key ResistanceOn the 4-hour chart, Shiba Inu trades above the SMA, showcasing strong bullish momentum as it approaches the $0.00002045 resistance level. Solid buying pressure combined with the formation of bullish candlesticks indicates a robust upward trajectory, making a test of this level highly likely.
An analysis of the 4-hour Relative Strength Index (RSI) indicates the potential for continued upward movement, with the RSI surpassing the 90% threshold and showing no signs of a near-term decline. This suggests that recent resilience is gaining strength and the positive trend may persist.
Also, SHIB has successfully crossed above the 100-day Simple Moving Average (SMA) on the daily chart, indicating a significant shift in its price momentum. Holding its position above this indicator demonstrates the asset’s resilience and reinforces its optimistic sentiment. The upward movement is not merely a momentary spike, it reflects strong buying interest and market confidence, suggesting that SHIB is poised for further gains.
On the daily chart, the RSI is positioned at 81%, reflecting that Shiba Inu is approaching overbought levels. While this shows robust buying pressure, it also raises the possibility of a potential pullback if the current upsurge weakens.
Will SHIB Break Through The $0.00002631 Barrier?It is important to note that the $0.00002045 level serves as a critical junction for SHIB’s current surge. Should the meme coin manage to maintain its upward momentum and break through this barrier, it could pave the way for further gains toward the $0.00002631 resistance level and beyond.
Nonetheless, failure to break through the barrier could lead to a retracement to the previous support level of $0.00001272. When this level is breached, it may trigger deeper declines, potentially dropping toward $0.00000847 and other lower ranges.
With a market capitalization exceeding $11 billion and a trading volume of over $1.3 billion, SHIB was trading at approximately $0.00001951, reflecting a 19.6% increase at the time of writing. Over the last 24 hours, its market cap has risen by 19.6%, while trading volume experienced a 101.33% increase.
Why this matters
This cryptocurrency story adds another data point to the current market tape and is useful when read alongside nearby source coverage.
Original source
Read on NewsBTCRelated market context

Elon Musk Grok AI Predicts a Bold Move for Ethereum in 2026
When prompted, the Elon Musk-backed Grok AI predicts a bold move for Ethereum (ETH) over the remainder of 2026. It claims that if...
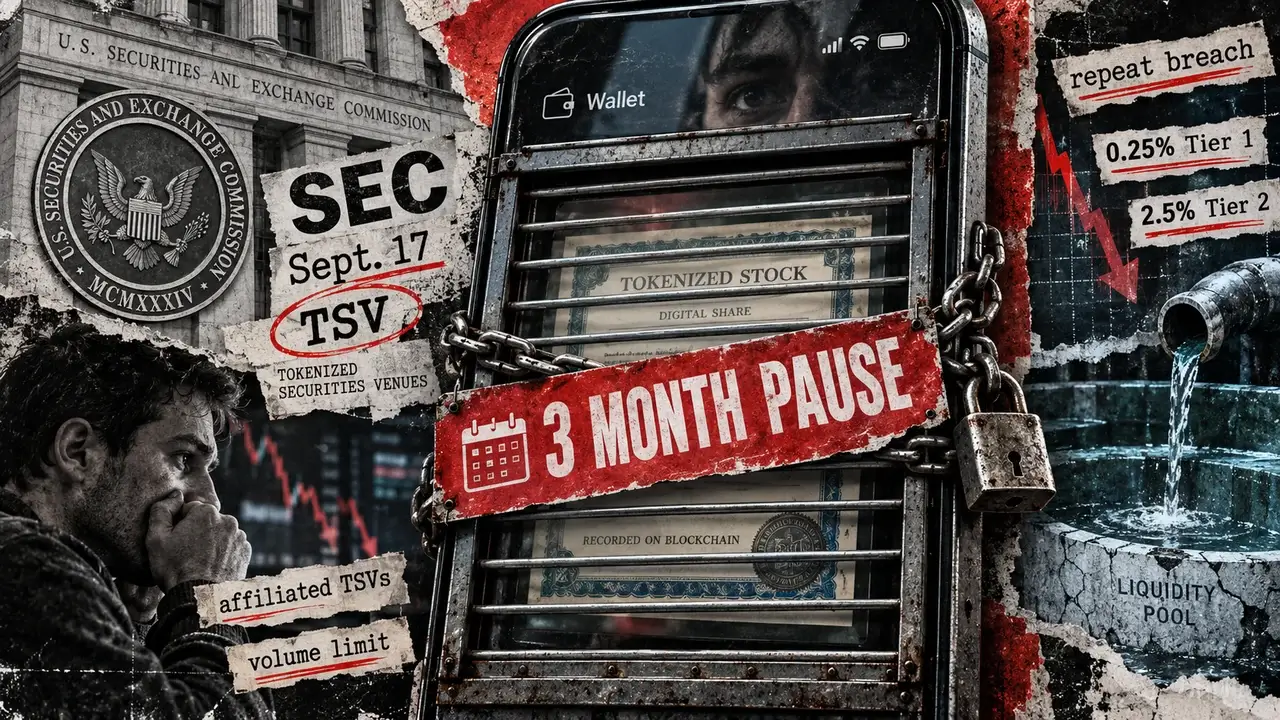
Why your tokenized stock could stop trading for three months
Buying a tokenized stock sounds as though it should be simple. You pick a company you know, buy a token representing its shares, a...

Ripple CEO Brad Garlinghouse Says XRP and Solana Can Both Thrive in Crypto’s Next 5 Years
Garlinghouse’s comments have resurfaced as XRP and Solana both trade near important technical levels following recent gains. “I’m...

Bitcoin (BTC) Price Today: BTC Holds Uptrend as $84K FVG Shapes Intraday Setup
The setup comes as on-chain data shows that profit-taking remains relatively contained despite the latest Bitcoin price recovery....

Bitcoin Price Prediction: ETF Flows Turned Green After $5.8 Billion Outflow
Bitcoin price is hovering around $86,500 with a sharp 13.90% run over the past week, which keeps its bullish prediction intact. Th...
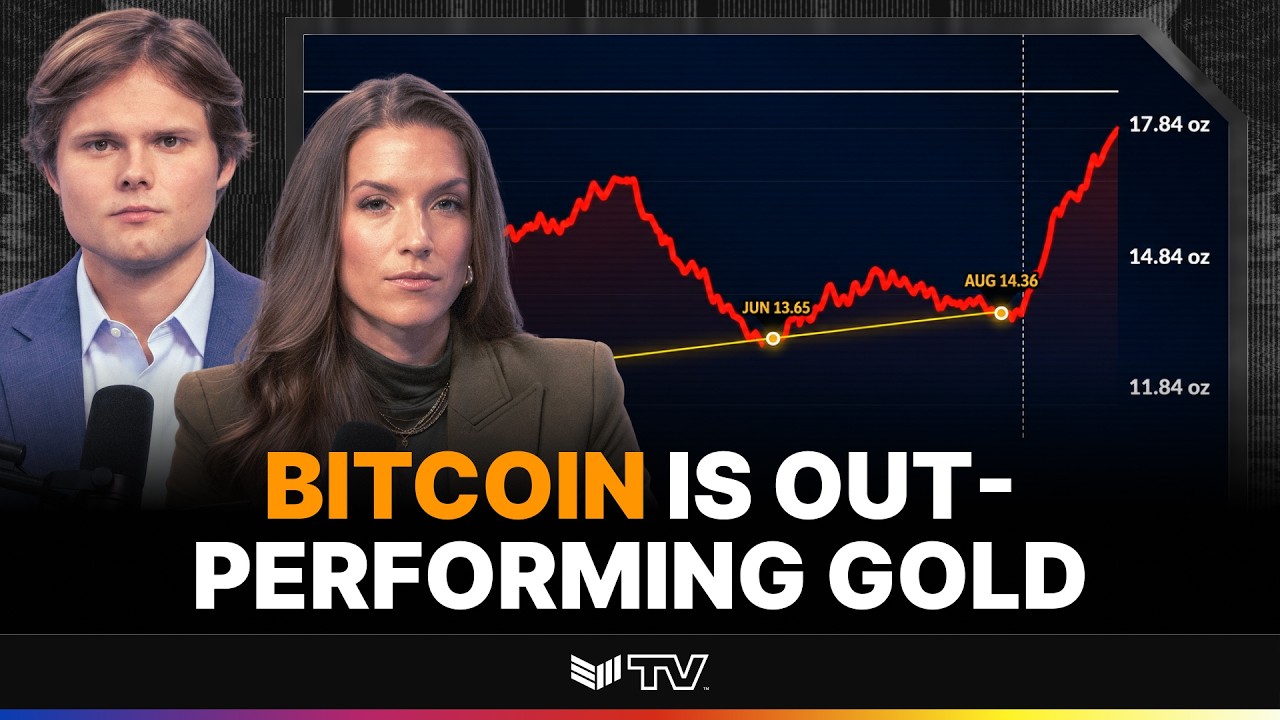
TECHNICAL ANALYSIS: BTC to Cross Key Price Level Against Gold
Bitcoin Magazine TECHNICAL ANALYSIS: BTC to Cross Key Price Level Against Gold The 90-day correlation between Bitcoin and gold jus...