Shiba Inu Bulls Roar To Life After Breakout—Next Price Targets
Shiba Inu (SHIB) printed a textbook-grade inverted head-and-shoulders on the daily chart this spring, and Tuesday’s session shows the pattern has now gone through the full breakout-and-retest sequence flagged by independ...
Archive context
Older archive item. Useful for background and entity history, but not a fresh market-moving signal.
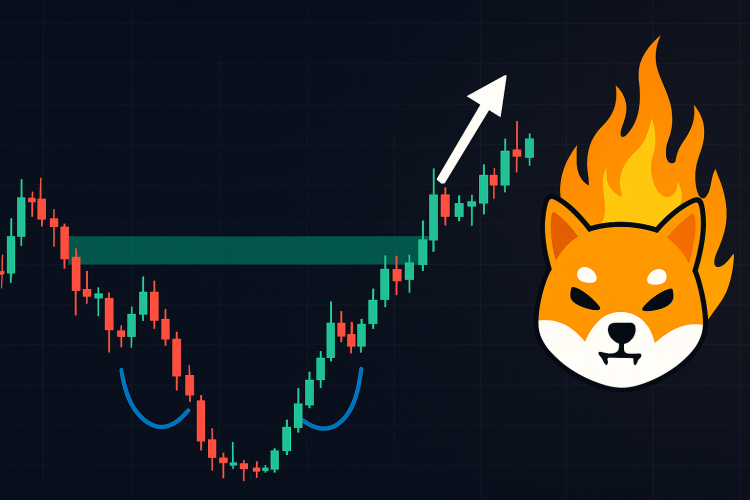
Shiba Inu (SHIB) printed a textbook-grade inverted head-and-shoulders on the daily chart this spring, and Tuesday’s session shows the pattern has now gone through the full breakout-and-retest sequence flagged by independent analyst Cantonese Cat (@cantonmeow).
Shiba Inu Completes iH&S PatternThe structure took shape over three distinct troughs: a left shoulder that bottomed just above $0.00001082 in mid-March, a head that wicked to about $0.00001030 in early-April, and a right shoulder that found support near $0.00001230 in the opening days of May. That sequence carved out an arc lasting more than two months, culminating in a decisive surge from May 8 that vaulted price through the neckline with a long, full-bodied green candle.
Momentum on that breakout carried SHIB as high as the $0.00001765 region—its loftiest print since early-February—before profit-taking invited a classic “throwback.” Over the past sessions the token has slid back into the neckline zone, where bid interest has so far absorbed supply, validating the level as a fresh support zone between $0.00001400 and $0.00001470. The successful retest is the final criterion many technicians require before calling the pattern complete.
Measured from the head’s extreme to the midpoint of the neckline, the vertical depth of the formation is roughly $0.0000037. Applying that distance to the breakout area confirms the local top at $0.00001765.
Cantonese Cat summarised the setup succinctly: “SHIB daily – inverted H&S brokeback pattern completed. Favors bullish continuation.” With the neckline now acting as a springboard, price action over the next few sessions will determine whether bulls can translate the technical victory into fresh upside follow-through or whether bears manage to drag the token back into the former trading range.
SHIB Price TargetsUpside targets can be found with the help of Fibonacci retracement levels. Anchoring the grid to last summer’s $0.00004569 high and the March swing low at $0.00001030 produces a 23.6 percent retracement at $0.00001865 which forms the second technical waypoint, only after the 200-day EMA at $0.00001603.
Should buyers reclaim both lines on a closing basis, the roadmap points toward $0.00002382 (38.2 percent) and the midpoint level at $0.00002799, an area that also coincides with the lower margin of last December’s congestion zone. Beyond it, the golden-ratio mark at $0.00003217 and the 78.6 percent retracement at $0.00003811 frame the penultimate obstacles before any renewed challenge of the macro peak.
Conversely, failure to defend the neckline shelf near $0.00001430 would invalidate the bullish script and shift short-term risk back to the 50-day EMA around $0.00001399 and ultimately to the cycle floor at $0.00001030. Until that downside failsafe is breached, the Fibonacci grid argues that momentum remains skewed in favor of buyers pressing for a return into the high-teens and, potentially, the low-twenties in the weeks to follow.
Why this matters
This cryptocurrency story adds another data point to the current market tape and is useful when read alongside nearby source coverage.
Original source
Read on NewsBTCRelated market context

Hyperliquid (HYPE) Price Prediction: Symmetrical Triangle Breakout Puts $77 Target Back in Focus
The breakout comes after several sessions of price compression, with HYPE continuing to trade within a broader technical structure...

Solana Price Prediction: SOL Holds Near $81 as Breakout Setup Points to $87, but Whale Flows Keep Risk Active
Solana price is back in focus after a sharp recovery pushed SOL towards the $81 area. The move has improved short-term momentum, e...

Bitcoin whales send 49,000 BTC to exchanges as $60K rebound shows signs of weakness
Bitcoin’s recovery above $60,000 is facing a fresh test from exchange-flow and derivatives data after large holders moved one of t...

Bitcoin Rebounds Toward $63,000, But ETF Flows Still Hold The Key
Bitcoin has started the new week with a little more colour on the screen. After sliding through the kind of levels that usually tr...

Vitalik’s Lean Ethereum Plan Targets 10x Lower Fees, Quantum Safety, and Faster Finality
Key Takeaways: Vitalik Buterin announced the multi-year “Lean Ethereum” roadmap and declared it a third generation update for Ethe...

Ethereum returns to top 100 global assets as market cap climbs back above $215 billion
Ethereum's market cap recovery enhances its appeal to institutional investors, potentially boosting its role in decentralized fina...