Shiba Inu Falls Below $0.00002631 As Bears Dominate The Market, Time To Buy?
Shiba Inu (SHIB) has seen intense bearish pressure as its price slips below the critical $0.00002631 level. This downward move reflects growing market challenges, with SHIB struggling to maintain its position above the 1...
Archive context
Older archive item. Useful for background and entity history, but not a fresh market-moving signal.
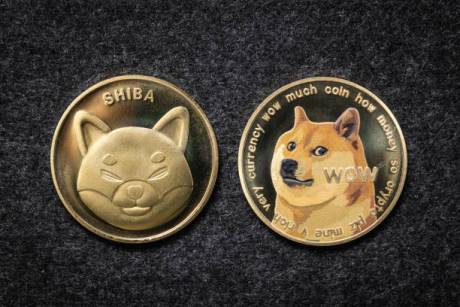
Shiba Inu (SHIB) has seen intense bearish pressure as its price slips below the critical $0.00002631 level. This downward move reflects growing market challenges, with SHIB struggling to maintain its position above the 100-day Simple Moving Average (SMA). The break below this key threshold highlights the dominance of sellers, raising questions about the token’s ability to recover in the short term.
As negative momentum builds, SHIB’s price action is at a pivotal point. Will bulls muster the strength to reclaim lost ground, or is the meme coin headed for deeper declines? The coming days will be crucial in determining the next phase of Shiba Inu’s journey.
Technical Indicators Signal Continued Bearish Pressure For Shiba InuCurrently, the price of Shiba Inu is trading below the 100-day SMA, a key technical indicator that often signals the broader trend in the market. Trading below this crucial level suggests that bearish momentum is outweighing bullish efforts, creating a challenging environment for SHIB.
The 100-day SMA typically acts as a dynamic support level in uptrends, helping to sustain upside strength. However, its current position below $0.00002631 indicates that the token has struggled to regain its upward trajectory.
Furthermore, this development raises concerns about SHIB’s ability to mount a recovery, as prolonged trading below this threshold could invite further selling pressure and deepen the pessimistic outlook. For SHIB to reclaim positive momentum, a decisive move back above the 100-day SMA is essential, triggering renewed strength and potential for recovery.
Additionally, the Relative Strength Index (RSI) indicator has experienced a significant drop, currently sitting at 35%. This sharp decline reflects a substantial loss of bullish strength, with selling pressure dominating the market. At 35%, the indicator suggests that Shiba Inu is approaching oversold territory, highlighting the intensity of the recent downward move.
Such a low RSI level could signal that the token is under heavy selling pressure and might be due for a short-term rebound if buyers begin to step in. However, the persistent bearish momentum could drive SHIB’s price downward without a clear shift in market sentiment or buying activity. Monitoring the RSI in conjunction with other technical indicators will be crucial for identifying potential reversal points or continued downside risks.
Key Support Levels Below $0.00002631: How Low Can SHIB Go?As Shiba Inu slips below the critical $0.00002631 level, attention shifts to the next key support zone that could determine its price trajectory. The immediate support lies near $0.00002045, a level previously shown resilience during bearish phases. If this fails to hold, SHIB could face more declines toward $0.00001272 or even lower, testing the strength of market sentiment.
However, if the bulls can gather enough strength at any of these support levels, it could trigger a recovery, pushing the price upward toward previous resistance zones. A rebound from these points would signal renewed buying interest and pave the way for Shiba Inu to regain lost ground, potentially reversing the bearish trend and reestablishing upward momentum.
Why this matters
This cryptocurrency story adds another data point to the current market tape and is useful when read alongside nearby source coverage.
Original source
Read on NewsBTCRelated market context
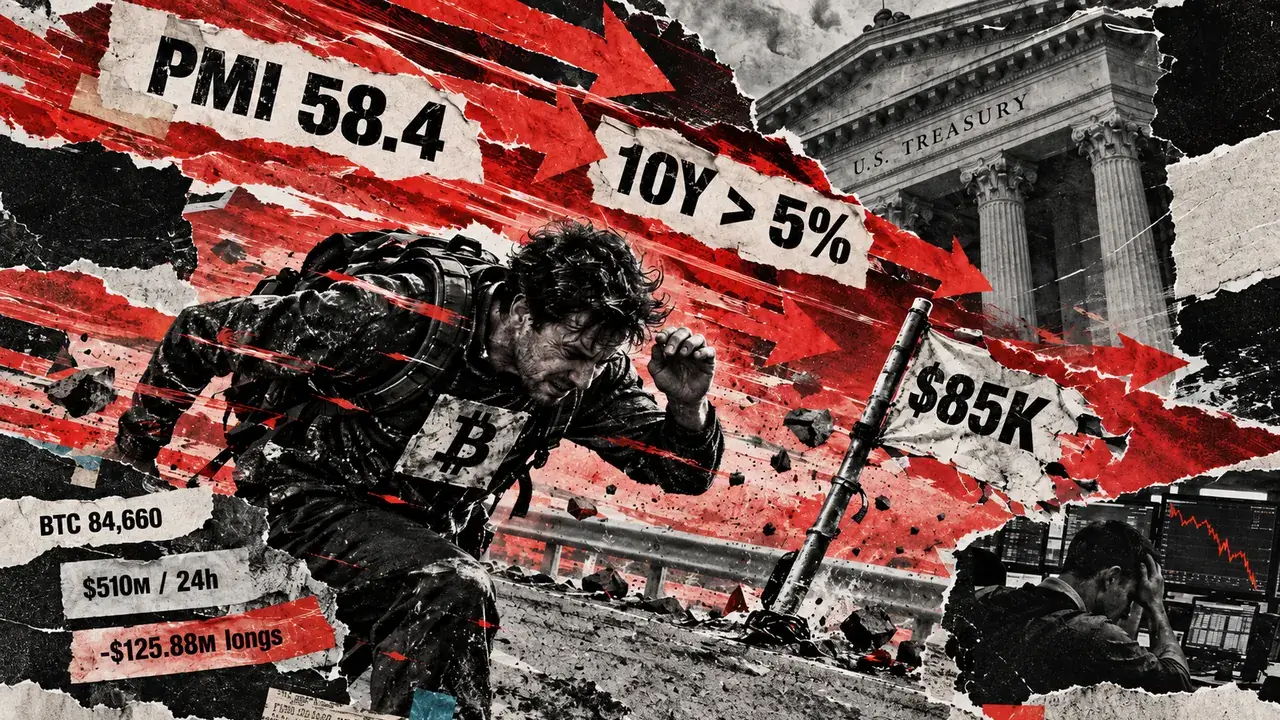
Bitcoin slips below $85,000 as 5% Treasury yield returns to haunt risk assets
Bitcoin fell below $85,000 on Sept. 23 after stronger-than-expected US business activity sent Treasury yields higher and flushed l...

Cardano Native Tokens to get full institutional custody support on Fireblocks by March 2027
The integration could significantly boost institutional adoption of Cardano, enhancing its ecosystem's credibility and market reac...

Fed Rate Cut Delayed as Strong Jobs Data Tests Bitcoin
Citigroup pushed its forecast for the Fed first interest rate cut to June 2027 after US employers added 162,000 jobs in August, mo...

Hyperliquid (HYPE) Price Prediction: Can Whale Buying and Binance Listing Drive HYPE to $210?
The technical setup for Hyperliquid price currently places $110, $130, $160, and $180 among the key levels to watch, while some tr...

Blockchain.com and NYSE Target 24/7 Tokenized Stocks for 44 Million Crypto Accounts
Key Takeaways: Blockchain.com made a deal with NYSE to test 24/7/365 access to tokenized U.S. stocks and ETFs. Subject to regulato...

Ethereum Price Prediction: BlackRock Says AI Stablecoin Payments Could Drive ETH Demand
Ethereum trades at $2,695, down 2.6% over the past 24 hours, with the latest price prediction still shaped by its 10.3% seven-day...