Terra Price Continues Moving North; How Soon Will It Cross $100?
Terra (LUNA) has made a considerable comeback given the slump that the coin underwent a little over a week ago. The broader market has also regained strength which has proved to be beneficial for the industry’s altcoins....
Archive context
Older archive item. Useful for background and entity history, but not a fresh market-moving signal.

Terra (LUNA) has made a considerable comeback given the slump that the coin underwent a little over a week ago.
The broader market has also regained strength which has proved to be beneficial for the industry’s altcoins. Bitcoin and Ethereum have steadied above their immediate price floors. The prominent coins were eyeing the next price ceilings at the time of writing.
Over the last 24 hours, the coin rose over 4% and in a week’s time, Terra brought home gains worth 13%. Among the top ten coins, Terra (LUNA) remains one of the highest gainers.
The global cryptocurrency market cap today was at $2.04 trillion and there has been a gain of 1.3% over the past day.
Terra (LUNA) Price Analysis: Four-Hour Chart Terra was bordering the $100 price mark on the four-hour chart. Image Source: LUNA/USD on TradingView
Terra’s bulls have regained strength and the prices were bordering $100. At the time of writing, Terra was valued at $99.27. The immediate resistance mark for the coin once it crosses the $100 mark would stand at $106.
The support level for the coin stood at $91.82 and failed to sustain over which the coin fill fall to $83.81. The price of the coin was seen moving upwards in an ascending channel. A price pullback could be on the charts given how the coin has secured a double-digit gain over the past week.
The volume of Terra was seen closing in the green which signified that the coin witnessed bullishness. A small bar suggests that the coin hasn’t been experiencing high selling volume and also that people have continued to HODL.
Suggested Reading | Conquering Terrain: Terra’s Stablecoin UST Is Now Crypto’s Third Biggest
Technical Analysis Terra experiences over-sold conditions on the four-hour chart. Image Source: LUNA/USD on TradingViewTerra was priced at $99.27 at the time of writing. After recovering considerably over a week, the buyers seem to have regained confidence in the asset. On the Relative Strength Index, the coin displayed a sharp recovery.
The indicator was seen above the half-line, near the 80-mark. This reading meant that buyers were in excess in the market. The asset was overbought at the time of writing. It is a possibility that if the coin remains in the overbought zone for a little longer, then there could be a chance of price correction.
Related Reading | Inside Terra’s $2.38 Billion Reserves, What Made The Lineup?
Terra has picked up bullish momentum on the four-hour chart | Source: LUNA/USD on TradingView.comTerra was bordering its immediate price resistance, however, the coin was rejected from $100 for a week or so. The price momentum of the coin was quite bullish as seen on the MACD. The indicator underwent a bullish crossover and displayed green bars at the time of writing.
The Directional Movement Index indicates price momentum and it displays positive price momentum on the four-hour chart. The Average Direction Index (ADX) also was seen above the 25-mark which is a sign of market strength and upside movement.
In accordance with the other indicators, Terra might aim for the $106 price mark over the immediate trading sessions which would mean a 7% appreciation for the coin.
Featured image from UnSplash, Charts from TradingView.comWhy this matters
This cryptocurrency story adds another data point to the current market tape and is useful when read alongside nearby source coverage.
Original source
Read on NewsBTCRelated market context

One Paper, Infinite Markets: MEXC Marks 18 Years of the Bitcoin Whitepaper by Looking Beyond Bitcoin
Mutsamudu, Comoros, November 2, 2026 – MEXC, a pioneer in 0-fee digital asset trading, launched its Bitcoin Whitepaper Day 2026 ca...

HSBC’s RedCoin stablecoin attracts 50,000 users in just over a week
HSBC's RedCoin success highlights banks' potential dominance in regulated stablecoin markets, challenging crypto-native firms' inf...
Crypto Weekly: Binance Hack Deepens Crypto Rout as Market Cap Falls to $2.7T
The cryptocurrency market ended October down 10%, with its total capitalization falling from $3 trillion to $2.7 trillion amid wid...

Trump-linked American Bitcoin takes a $2.1 billion route to the public markets
The merger highlights potential market volatility and investor dilution risks, while emphasizing concentrated control in the Bitco...

Bitcoin ETFs Lose $203M as Friday Rout Wipes out Weekly Gains
Bitcoin ETFs lost $202.59 million in the week through Oct. 30 after a violent Friday reversal erased four days of inflows. Ether s...

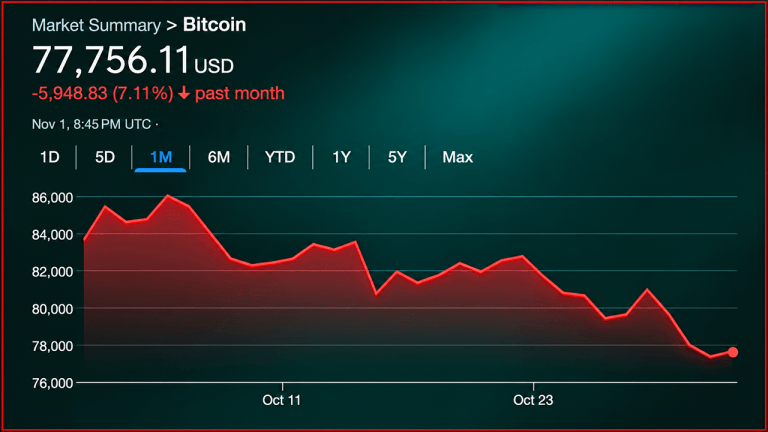
Bitcoin Steadies Near $78,000 as Binance Withdrawals Resume
Bitcoin traded at $77,926 at 11:02 UTC on Monday, according to CoinGecko data, about 2% above its post-Binance hack low near $76,1...