Tron Price Prediction: TRX Bulls Keeps Pushing, Why Rally Isn’t Over Yet
Tron price is gaining pace above $0.0850 against the US Dollar. TRX is outperforming Bitcoin and could rise further toward $0.092. Tron is moving higher above the $0.0850 resistance level against the US dollar. The price...

Tron price is gaining pace above $0.0850 against the US Dollar. TRX is outperforming Bitcoin and could rise further toward $0.092.
- Tron is moving higher above the $0.0850 resistance level against the US dollar.
- The price is trading above $0.0862 and the 100 simple moving average (4 hours).
- There is a major bullish trend line forming with support near $0.0855 on the 4-hour chart of the TRX/USD pair (data source from Kraken).
- The pair could continue to climb higher toward $0.092 or even $0.095.
In the last Tron price analysis, we discussed the chances of more gains in TRX against the US Dollar. TRX remained stable, outperformed Bitcoin, and traded above the $0.082 resistance level.
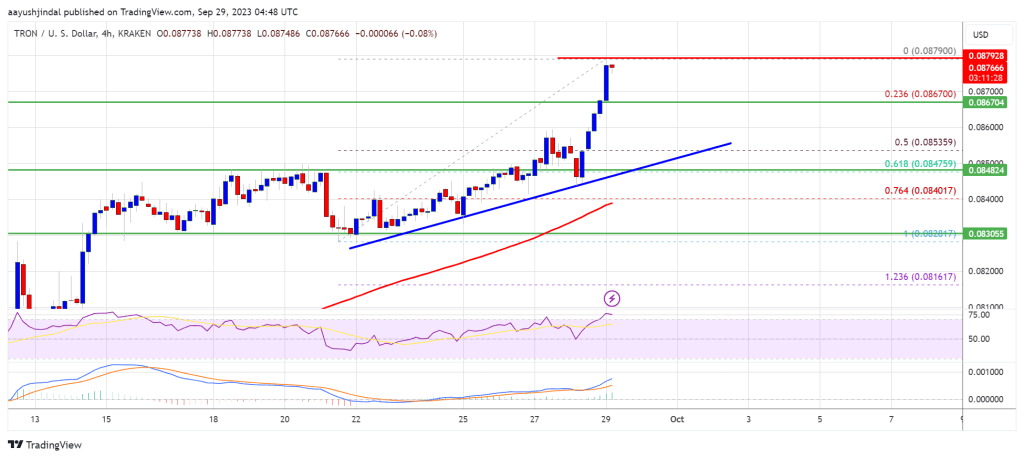
The bulls were able to pump the price above the $0.0825 and $0.0850 resistance levels. A high was formed near $0.0879 and the price is currently consolidating gains. The current price action suggests that the price could climb further higher above $0.088.
It is now trading well above the 23.6% Fib retracement level of the upward move from the $0.0820 swing low to the $0.0879 high. TRX is also trading above $0.0865 and the 100 simple moving average (4 hours). There is also a major bullish trend line forming with support near $0.0855 on the 4-hour chart of the TRX/USD pair.
On the upside, an initial resistance is near the $0.088 level. The first major resistance is near $0.0920, above which the price could accelerate higher. The next resistance is near $0.095.
Source: TRXUSD on TradingView.com
A close above the $0.095 resistance might send TRX further higher toward $0.10. The next major resistance is near the $0.105 level, above which the bulls are likely to aim for a larger increase toward $0.112.
Are Dips Limited in TRX?If TRX price fails to clear the $0.088 resistance, it could start a downside correction. Initial support on the downside is near the $0.0867 zone. The first major support is near the $0.0855 level or the trend line.
The trend line is near the 50% Fib retracement level of the upward move from the $0.0820 swing low to the $0.0879 high, below which it could test the 100 simple moving average (4 hours). The next major support is $0.0830.
Technical Indicators
4 hours MACD – The MACD for TRX/USD is gaining momentum in the bullish zone.
4 hours RSI (Relative Strength Index) – The RSI for TRX/USD is currently above the 50 level.
Major Support Levels – $0.0867, $0.0855, and $0.0830.
Major Resistance Levels – $0.0880, $0.0920, and $0.0950.
Original source
Read on NewsBTCRelated market context

Fireblocks Says Institutional ETH Staking Is Moving Toward Standardized Rails
TL;DR Fireblocks says it has launched ETH Staking Link, a standardized interface for institutional Ethereum staking integrations....

Bitcoin price challenges $64,000 weekend wall – needing a breakout or risk a deeper correction
Bitcoin reclaimed $64,000 on June 12 and touched an intraday high of $64,301 in the same session that spot ETF flows finally flipp...

Bitcoin rises above $64,000 after Pakistan prime minister says Iran peace deal is near
Bitcoin traded above $64,000 on Saturday, supported by its strongest ETF inflows in a month and growing optimism around geopolitic...

Bitcoin price faces new risk as big buyers lose conviction
Bitcoin’s largest buyers are no longer behaving like a reliable backstop for the largest cryptocurrency. The exchange-traded funds...

Google Gemini AI Predicts Jaw-Dropping XRP Price For Next 90 Days
Google Gemini AI just put XRP back under the spotlight, predicting it is tightly wound for a major breakout toward $1.60 to $1.80...

Elon Musk SpaceX AI Predicts Incredible Bitcoin Price For Next 30 Days
Here is the thing about capitulation calls. They only sound smart in hindsight. Right now, with Bitcoin price scraping along the l...