Tron Price (TRX) Surges Ahead: Leading the Altcoins Pack
Tron price is gaining pace above the $0.1150 resistance against the US Dollar. TRX is outperforming Bitcoin and could rise further above $0.1180. Tron is moving higher above the $0.1150 resistance level against the US do...

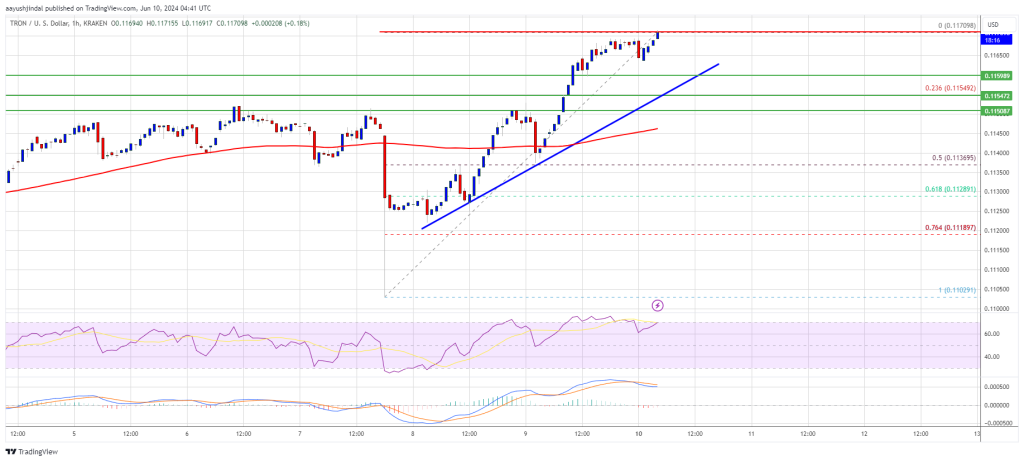
Tron price is gaining pace above the $0.1150 resistance against the US Dollar. TRX is outperforming Bitcoin and could rise further above $0.1180.
- Tron is moving higher above the $0.1150 resistance level against the US dollar.
- The price is trading above $0.1155 and the 100-hourly simple moving average.
- There is a key bullish trend line forming with support at $0.1160 on the hourly chart of the TRX/USD pair (data source from Kraken).
- The pair could continue to climb higher toward $0.1200 or even $0.1220.
Recently, Bitcoin and Ethereum saw a fresh decline below $68,500 and $3,750 respectively. However, Tron price remained stable above the $0.1120 support and even climbed higher.
There was a decent move above the $0.1150 resistance zone. TRX price cleared many hurdles and gained over 3%. There was a move above the $0.1165 level. A high is formed at $0.1170 and the price is now consolidating gains above the 23.6% Fib retracement level of the upward move from the $0.1102 swing low to the $0.1170 high.
Tron price is now trading above $0.1160 and the 100-hourly simple moving average. There is also a key bullish trend line forming with support at $0.1160 on the hourly chart of the TRX/USD pair.
On the upside, an initial resistance is near the $0.1170 level. The first major resistance is near $0.1180, above which the price could accelerate higher. The next resistance is near $0.1200. A close above the $0.1200 resistance might send TRX further higher toward $0.1225. The next major resistance is near the $0.1320 level, above which the bulls are likely to aim for a larger increase toward $0.150.
Are Dips Supported in TRX?If TRX price fails to clear the $0.1200 resistance, it could start a downside correction. Initial support on the downside is near the $0.1160 zone.
The first major support is near the $0.1150 level or the 100 simple moving average (4 hours), below which it could test $0.1140. Any more losses might send Tron toward the $0.1136 support in the coming sessions.
Technical Indicators
Hourly MACD – The MACD for TRX/USD is gaining momentum in the bullish zone.
Hourly RSI (Relative Strength Index) – The RSI for TRX/USD is currently above the 50 level.
Major Support Levels – $0.1160, $0.1150, and $0.1136.
Major Resistance Levels – $0.1180, $0.1200, and $0.1220.
Original source
Read on NewsBTCRelated market context

Fireblocks Says Institutional ETH Staking Is Moving Toward Standardized Rails
TL;DR Fireblocks says it has launched ETH Staking Link, a standardized interface for institutional Ethereum staking integrations....

Uranium Holds Above $85 as Mining ETF Rebounds From June Sell-Off
The latest charts display that the market is divided into stable physical prices and uranium shares trying to regain momentum afte...

Bitcoin rises above $64,000 after Pakistan prime minister says Iran peace deal is near
Bitcoin traded above $64,000 on Saturday, supported by its strongest ETF inflows in a month and growing optimism around geopolitic...

Bitcoin price faces new risk as big buyers lose conviction
Bitcoin’s largest buyers are no longer behaving like a reliable backstop for the largest cryptocurrency. The exchange-traded funds...

Tether USDT Briefly Overtakes Ethereum in Market Cap: A $187B Wake-Up Call
For a few hours, earlier this week, Tether USDT stablecoin held a higher market cap than Ethereum, the first time that has happene...

Bitcoin price challenges $64,000 weekend wall – needing a breakout or risk a deeper correction
Bitcoin reclaimed $64,000 on June 12 and touched an intraday high of $64,301 in the same session that spot ETF flows finally flipp...