UNI Price Prediction – Uniswap Turns Green and Eyes More Upsides
UNI price started a decent increase above the $$10.00 resistance. Uniswap is showing positive signs and might eye more upsides above the $11.75 resistance. UNI started a fresh increase above the $10.00 resistance zone. T...

UNI price started a decent increase above the $$10.00 resistance. Uniswap is showing positive signs and might eye more upsides above the $11.75 resistance.
- UNI started a fresh increase above the $10.00 resistance zone.
- The price is trading above $11.00 and the 100-hourly simple moving average.
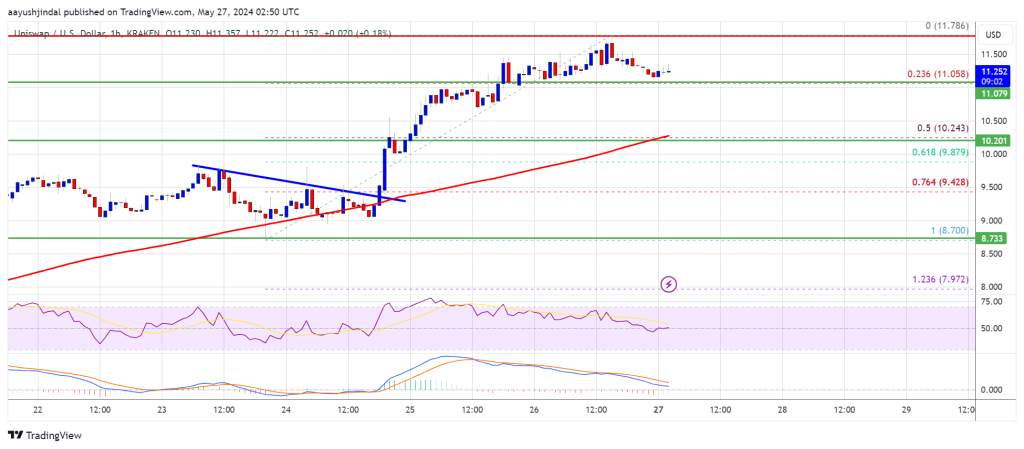
- There was a break above a connecting bearish trend line with resistance near $9.50 on the hourly chart of the UNI/USD pair (data source from Kraken).
- The pair might correct gains, but the bulls might eye more upsides above $11.75 in the near term.
After forming a base above the $8.80 level, Uniswap started a fresh increase like Bitcoin and Ethereum. UNI price gained pace for a move above the $9.20 and $9.50 resistance levels.
There was a break above a connecting bearish trend line with resistance near $9.50 on the hourly chart of the UNI/USD pair. The bulls even pushed the price above the $10.50 and $11.20 resistance levels. Finally, the bears appeared near the $11.75 zone.
A high was formed near $11.78 and the price is now consolidating gains near the 23.6% Fib retracement level of the upward move from the $8.70 swing low to the $11.78 high.
UNI is now trading above $11.00 and the 100-hourly simple moving average. Immediate resistance is near the $11.50 level. The next key resistance is near the $11.75 level. A close above the $11.75 level could open the doors for more gains in the near term. The next key resistance could be near $12.20, above which the bulls are likely to aim a test of the $12.50 level. Any more gains might send UNI toward $13.50.
Are Dips Supported In Uniswap?If UNI price fails to climb above $11.50 or $11.75, it could start a downside correction. The first major support is near the $11.05 level.
The next major support is near the $10.25 level or the 50% Fib retracement level of the upward move from the $8.70 swing low to the $11.78 high. A downside break below the $10.25 support might open the doors for a push toward $8.80.
Technical Indicators
Hourly MACD – The MACD for UNI/USD is losing momentum in the bullish zone.
Hourly RSI (Relative Strength Index) – The RSI for UNI/USD is near the 50 level.
Major Support Levels – $11.05, $10.50, and $10.25.
Major Resistance Levels – $11.50, $11.75, and $12.20.
Original source
Read on NewsBTCRelated market context

Uranium Holds Above $85 as Mining ETF Rebounds From June Sell-Off
The latest charts display that the market is divided into stable physical prices and uranium shares trying to regain momentum afte...

Bitcoin rises above $64,000 after Pakistan prime minister says Iran peace deal is near
Bitcoin traded above $64,000 on Saturday, supported by its strongest ETF inflows in a month and growing optimism around geopolitic...

Standard Chartered Says Bitcoin Bottomed Near $59,000 As Crypto Winter Ends
TL;DR Standard Chartered’s Geoffrey Kendrick reportedly says Bitcoin’s $59,000 area marked the cycle bottom. The note cites SpaceX...

Google Gemini AI Predicts Jaw-Dropping XRP Price For Next 90 Days
Google Gemini AI just put XRP back under the spotlight, predicting it is tightly wound for a major breakout toward $1.60 to $1.80...

Bitcoin price challenges $64,000 weekend wall – needing a breakout or risk a deeper correction
Bitcoin reclaimed $64,000 on June 12 and touched an intraday high of $64,301 in the same session that spot ETF flows finally flipp...

Bitcoin price faces new risk as big buyers lose conviction
Bitcoin’s largest buyers are no longer behaving like a reliable backstop for the largest cryptocurrency. The exchange-traded funds...