Uniswap Price on the Rise: UNI Eyes Set on Further Gains
UNI price started a fresh increase above the $9.50 resistance. Uniswap is showing positive signs and might eye more upsides above the $10.00 resistance. UNI started a fresh increase above the $9.50 resistance zone. The p...
Archive context
Older archive item. Useful for background and entity history, but not a fresh market-moving signal.

UNI price started a fresh increase above the $9.50 resistance. Uniswap is showing positive signs and might eye more upsides above the $10.00 resistance.
- UNI started a fresh increase above the $9.50 resistance zone.
- The price is trading above $9.60 and the 100-hourly simple moving average.
- There is a key bearish trend line forming with resistance near $10.15 on the hourly chart of the UNI/USD pair (data source from Kraken).
- The pair might aim for more upside if there is a clear move above the $10.20 resistance.
After forming a base above the $8.75 level, Uniswap started a fresh increase like Bitcoin and Ethereum. UNI price gained pace for a move above the $9.20 and $9.50 resistance levels.
The price even cleared the $10.00 resistance zone. A high was formed at $10.32 before the price started a downside correction. There was a drop below the $10.00 level and the 23.6% Fib retracement level of the upward move from the $8.72 swing low to the $10.32 high.
UNI is still trading above $9.50 and the 100-hourly simple moving average. Immediate resistance is near the $10.00 level. The next key resistance is near the $10.20 level. There is also a key bearish trend line forming with resistance near $10.15 on the hourly chart of the UNI/USD pair.
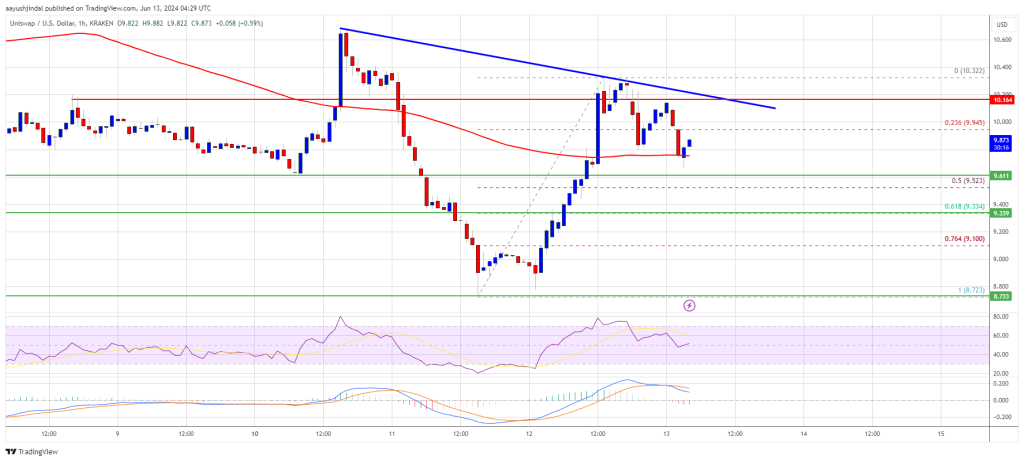
A close above the $10.20 level could open the doors for more gains in the near term. The next key resistance could be near $10.65, above which the bulls are likely to aim a test of the $11.50 level. Any more gains might send UNI toward $12.00.
Are Dips Limited In Uniswap?If UNI price fails to climb above $10.00 or $10.20, it could slowly move down. The first major support is near the $9.50 level or the 50% Fib retracement level of the upward move from the $8.72 swing low to the $10.32 high.
The next major support is near the $9.35 level. A downside break below the $9.35 support might open the doors for a push toward $9.00.
Technical Indicators
Hourly MACD – The MACD for UNI/USD is losing momentum in the bullish zone.
Hourly RSI (Relative Strength Index) – The RSI for UNI/USD is above the 50 level.
Major Support Levels – $9.50, $9.35, and $9.00.
Major Resistance Levels – $10.00, $10.20, and $10.65.
Why this matters
This cryptocurrency story adds another data point to the current market tape and is useful when read alongside nearby source coverage.
Original source
Read on NewsBTCRelated market context

Ethereum Layer 2 Blast Is Shutting Down, Saying Costs Now Exceed What the Chain Earns
Blast, the Ethereum layer 2 network created by Blur founder Tieshun “Pacman” Roquerre, is shutting down, its team announced on X o...

XRP Price, $300M ETF Demand, and 45% Q3 Supply Overhang
XRP price rose more than 45% in Q3 as U.S. spot XRP ETFs attracted about $307.9 million, yet the token entered October near $1.50...

Bitcoin (BTC) Price Today: 2028 Halving Cycle and BlackRock ETF Inflow Signal Long-Term Rally
Recent market data also show that Bitcoin buyers have absorbed a key sell wall around $85,000, reducing one source of near-term re...
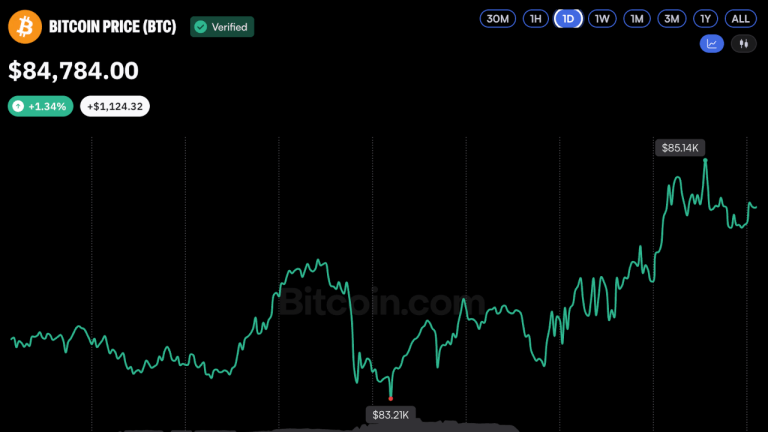
Bitcoin Price Enters October Near $85K—Now $95K Is Back in Play
Bitcoin closed September at $83,563, above several closely watched onchain and technical levels as October begins with a historica...

New SEC crypto rules threaten small advisers, but big firms win
The US Securities and Exchange Commission’s proposed crypto custody fallback could broaden investment choices while making them ea...

Bitcoin Price Surges Above $87,000 on Softer-Than-Expected Jobs Data
Bitcoin Magazine Bitcoin Price Surges Above $87,000 on Softer-Than-Expected Jobs Data The price of bitcoin surged above $87,000 on...