WIF Bulls Charge Toward $2.89 As Key Resistance Test Looms
Recent trading activity reveals that WIF is gaining bullish momentum, with its price surging toward the critical $2.89 resistance level. After a brief pullback, buyers are stepping in, driving the asset higher and settin...
Archive context
Older archive item. Useful for background and entity history, but not a fresh market-moving signal.

Recent trading activity reveals that WIF is gaining bullish momentum, with its price surging toward the critical $2.89 resistance level. After a brief pullback, buyers are stepping in, driving the asset higher and setting the stage for a potential breakout. A successful break could open the door to new gains, further reinforcing the positive sentiment in the market.
As the price approaches this crucial level, the goal of this analysis is to determine whether WIF can sustain its upward strength and break through the $2.89 resistance. By evaluating key technical indicators, price trends, and market sentiment, this review will delve into the possible outcomes of this pivotal test, assessing the likelihood of either a continued rally or a possible pullback.
Current Price Momentum: WIF Push Toward $2.89WIF is exhibiting strong bullish momentum following a recovery from the $2.6 support level. By consistently trading above the 100-day Simple Moving Average (SMA), the cryptocurrency indicates that buyers are firmly in control, reflecting a strengthening trend. Maintaining this position could enhance optimistic sentiment and generate the push necessary to challenge higher resistance levels, particularly the $2.89 mark.
An analysis of the 4-hour Relative Strength Index (RSI) indicates a renewed upbeat potential, with the RSI climbing back to 62% after dipping to 50%. If the RSI continues to rise, it could point to further gains for WIF, as the asset regains strength and attracts more bullish traders aiming to push the price toward key resistance zones.
Furthermore, the daily chart indicates that WIF is under significant upward pressure, marked by a bullish candlestick formation after rebounding from $2.6 and trading above the 100-day SMA. This suggests strong buyer activity, positioning the meme coin to challenge the critical resistance level of $2.89.
Also, the RSI on the daily chart currently stands at 66%, comfortably above the 50% threshold, indicating a positive shift in momentum for WIF. A sustained position above 50% generally signifies that buyers are in control. If this pressure continues, it could lead to more price appreciation as traders remain optimistic about the asset’s potential to break through key resistance levels.
Potential Outcomes: Rally Continuation Or Pullback?A continuation of the current rally could see WIF breaking above the $2.89 resistance, paving the way for further gains and possibly reaching new highs. This scenario is supported by the positive momentum indicated by the RSI and the price’s position above the 100-day Simple Moving Average.
Should WIF fail to break through the $2.89 resistance, it could face a pullback toward the $2.2 support level. A drop below this support would raise doubts about the sustainability of the current upward movement, potentially triggering a more significant decline toward the $1.5 support level.
Why this matters
This cryptocurrency story adds another data point to the current market tape and is useful when read alongside nearby source coverage.
Original source
Read on NewsBTCRelated market context

Ripple CEO Brad Garlinghouse Says XRP and Solana Can Both Thrive in Crypto’s Next 5 Years
Garlinghouse’s comments have resurfaced as XRP and Solana both trade near important technical levels following recent gains. “I’m...

Elon Musk Grok AI Predicts a Bold Move for Ethereum in 2026
When prompted, the Elon Musk-backed Grok AI predicts a bold move for Ethereum (ETH) over the remainder of 2026. It claims that if...

Bitcoin (BTC) Price Today: BTC Holds Uptrend as $84K FVG Shapes Intraday Setup
The setup comes as on-chain data shows that profit-taking remains relatively contained despite the latest Bitcoin price recovery....

Bitcoin Price Never Closed Below Expectation in 2026 Bear Market
Bitcoin never posted a daily close below its realized price during the current bear market, and the June 2026 low held above that...
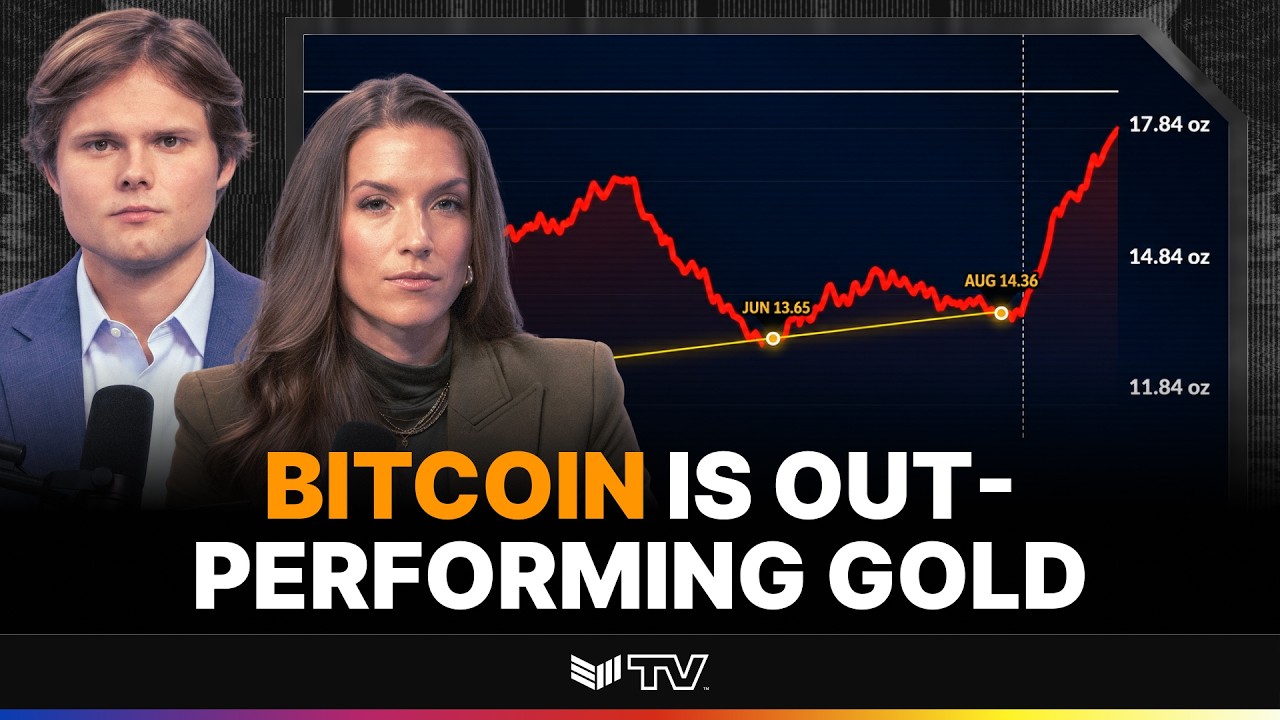
TECHNICAL ANALYSIS: BTC to Cross Key Price Level Against Gold
Bitcoin Magazine TECHNICAL ANALYSIS: BTC to Cross Key Price Level Against Gold The 90-day correlation between Bitcoin and gold jus...

Bitcoin Price Prediction: ETF Flows Turned Green After $5.8 Billion Outflow
Bitcoin price is hovering around $86,500 with a sharp 13.90% run over the past week, which keeps its bullish prediction intact. Th...