3 Ethereum charts flash signal last seen in 2017 when ETH price rallied 25,000%
Key takeaways:Ether price printed a rare monthly Dragonfly doji candlestick, which is often seen before major ETH bull market cycles.ETH is retesting its long-term parabolic support zone that preceded its historic 2017 r...
Archive context
Older archive item. Useful for background and entity history, but not a fresh market-moving signal.

Key takeaways:
Ether price printed a rare monthly Dragonfly doji candlestick, which is often seen before major ETH bull market cycles.
ETH is retesting its long-term parabolic support zone that preceded its historic 2017 rally.
The MVRV Z-Score has entered the accumulation zone, signaling undervaluation.
Ethereum’s native token, Ether (ETH), is flashing a combination of technical and onchain signals once seen in the early stages of its 2017 bull run, a cycle that produced over 25,000% gains.
Dragonfly doji hints ETH bulls are regaining controlEther is flashing a rare Dragonfly Doji candlestick on its monthly chart, the same structure that preceded its historic 25,000% rally during the 2017 bull cycle.
This pattern is confirmed when the price prints a long lower wick, little to no upper wick, and closes at or near its opening level.
On Ether’s monthly chart, the candlestick reflects a sharp intra-month rejection of lower prices, suggesting that bulls are beginning to regain control after an extended downtrend.
ETH/USD monthly price chart. Source: TradingViewIn December 2016, Ether formed a similar monthly Dragonfly doji before erupting from under $6 to over $1,400 in over a year. The same pattern has been seen, with smaller upside, in 2021 and 2023, where ETH gained over 80% and 145%, respectively.
If bulls confirm the signal with a strong May open, especially above April’s high of around $1,950, Ethereum could be primed for another multimonth rally, beginning with an initial run toward $2,100.
Ether tests long-term parabolic support, just like in 2017Chartist Merlijn the Trader points to Ethereum retesting its long-term parabolic support, (the green zone in the chart below) that has consistently acted as a launchpad for new uptrends.
ETH/USD weekly price chart. Source: TradingView/Merlijn The Trader“In every cycle, this zone triggers a reversal — and this time is no different,” he wrote in his X post on April 30, adding:
“Now begins what could be Ethereum’s most explosive rally yet.”In early 2017, ETH also bounced from this exact same parabolic trendline during its initial breakout phase. The trendline supported ETH throughout that year, fueling the vertical move to $1,400 from around $6.
Related: Ethereum’s ‘capitulation’ suggests ETH price is undervalued: Fidelity report
The current retest in 2025 mirrors that breakout setup, suggesting a cyclical pattern may be repeating.
Onchain data points to ICO-era-style ETH accumulation sentimentEther’s MVRV Z-Score, a key onchain metric used to identify market tops and bottoms, has re-entered the historical accumulation zone (the green band in the chart below), strengthening the argument that ETH may have found its cycle bottom.
Ethereum MVRV-Z Score chart. Source: GlassnodeIn past cycles, Ether’s MVRV Z-Score dipped into this green zone in late 2018, March 2020, and mid-2022. All of these dips coincided with market bottoms and preceded multimonth to multi-year rallies.
This article does not contain investment advice or recommendations. Every investment and trading move involves risk, and readers should conduct their own research when making a decision.
Why this matters
This ethereum story adds another data point to the current market tape and is useful when read alongside nearby source coverage.
Original source
Read on CointelegraphRelated market context

ETH USD Loses Ground as Ethereum Price Analysis Remains Targeting $3,000 This Week
Ethereum Price Prediction, September 23: Ethereum (ETH) trades at $2,735, down a marginal 0.61% over the past 24 hours, a pause, n...

Cloudflare Exec Says Ethereum’s Original Sharding Plan Could Work for Stablecoin Payments
Will Papper, Cloudflare‘s director of product for agent payments, said a blockchain split into parallel shard chains, the design E...
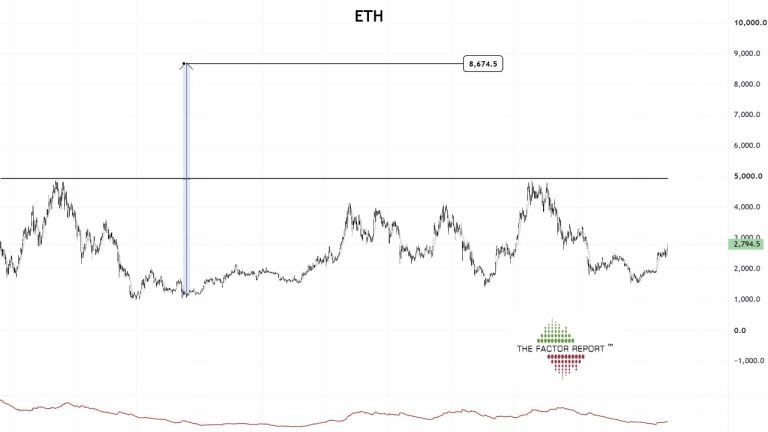
Peter Brandt Sees Ethereum at $8,600 if ETH Clears $5,000
Ethereum could eventually reach $8,600 if it first clears $5,000, according to a long-term chart posted by veteran trader Peter Br...

Ethereum ETFs Pull In $270M As BlackRock Leads September 21 Rebound
TL;DR US spot Ethereum ETFs recorded $270.0 million of net inflows for the September 21 session. BlackRock’s ETHA led the day with...

Solana flips Ethereum in fees, while ETH holds the burn lead
Solana generated more user fees than Ethereum in data provider DefiLlama's Sept. 22 dashboard snapshot, while Ethereum burned more...

Cloudflare’s Will Papper suggests Ethereum’s sharding design could enable scalable stablecoin payments
Cloudflare's adoption of Ethereum's sharding design for scalable stablecoin payments could revolutionize machine-to-machine transa...