Bitcoin, Ethereum Technical Analysis: BTC Below $30,000 Again as Crypto Consolidation Extends
Bitcoin prices dropped during the hump-day session, as bulls were unable to maintain Tuesday’s gains. The world’s largest cryptocurrency once again fell below the $30,000 level, whilst ETH also moved lower. Bitcoin Follo...
Archive context
Older archive item. Useful for background and entity history, but not a fresh market-moving signal.

Bitcoin prices dropped during the hump-day session, as bulls were unable to maintain Tuesday’s gains. The world’s largest cryptocurrency once again fell below the $30,000 level, whilst ETH also moved lower.
BitcoinFollowing a slight rally in price during Tuesday’s session, bearish sentiment returned to markets on Wednesday.
This sentiment saw BTC/USD drop to a bottom of $29,570.30, less than 24 hours after trading at a peak of $30,694.49.
Wednesday’s low sees a continuation of price consolidation, as traders continued to navigate through the current volatility within markets.
As a result of today’s move, bitcoin is now moving closer to a support level of $28,800, with the 14-day RSI remaining deep in oversold territory.
Looking at the chart, this indicator is currently tracking at 33.87, which is marginally below a ceiling of 35.
As discussed on Tuesday, it is unlikely that we will see an end to consolidation unless this level is firmly broken.
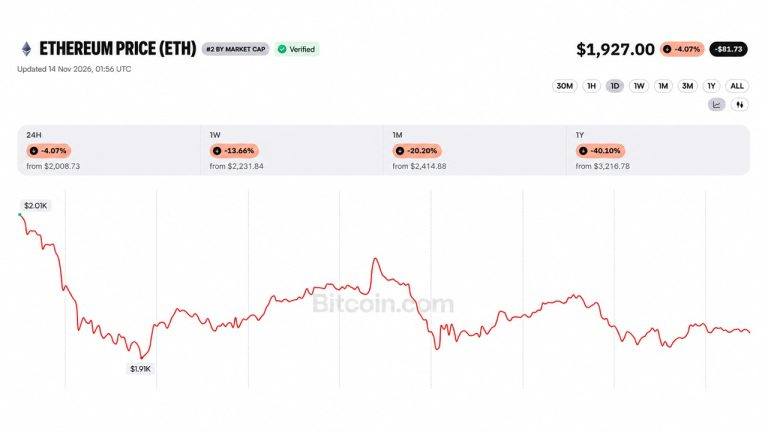
EthereumWhilst ETH also slipped in today’s session, it was able to once again remain above $2,000, despite a drop in price.
ETH/USD fell to an intraday low of $2,015.97 earlier in the day, which is just over 3% lower than yesterday’s high of $2,113.06.
Today’s move means that ETH is now trading around $80 away from its resistance point of $1,950.
Some expect this floor could be hit in upcoming sessions, especially with the RSI continuing to hover below its ceiling of 34.
The moving averages are also trending lower, with both 10-day and 25-day moving averages extending their respective downward directions.
Overall, ETH is currently 2.09% lower, with no real signs of this bearish pressure slowing down.
Where do you expect BTC and ETH to end up by the close of the week? Leave your thoughts in the comments below.
Why this matters
This ethereum story adds another data point to the current market tape and is useful when read alongside nearby source coverage.
Original source
Read on Bitcoin NewsRelated market context

Bitcoin Price Today: Negative Funding Rates Signal Growing Bearish Bets as BTC Nears $68K
The latest data presents a mixed picture, however, as Hyperliquid whales have returned to net-long positions despite deteriorating...

Lithium Market Outlook as $90,650 Spot Meets a Heavy ETF Resistance Wall in Q4
The Global X Lithium and Battery Tech ETF, on the other hand, dropped 2.64% to $59.46. This divergence indicates that there is not...

Bitcoin (BTC) Price Today: $65K Support Under Pressure as Glassnode Maps $60K–$62K Liquidation Cluster
Glassnode’s futures liquidation heat map identifies a concentrated cluster of leveraged long positions between $60,000 and $62,000...

XRP Price Today: $0.98 Support Under Threat Despite Oversold RSI
Deeply oversold indicators suggest a possible relief bounce, but the broader technical structure remains bearish. The XRP price ha...
Ether Price Dips Below $2K as Ethereum Foundation Dumps 5000 ETH in 5 Day
A wallet linked to the Ethereum Foundation sold another 1,000 ETH on Saturday, taking its five-day total to 5,000 ETH, or about $9...

Ethereum Dancing on Two Fronts as Quantum Upgrade Advances and Treasury Leverage Bites
Ethereum developers want to upgrade the network to be quantum-ready by 2027, potentially accelerating one of its biggest security...