Bitcoin, Ethereum Technical Analysis: BTC Hovers Below $24,000 on Friday, as Crypto Markets Consolidate
Cryptocurrency markets consolidated on Friday, as bulls marginally pulled back following strong gains in yesterday’s session. Bitcoin fell slightly below $24,000, as prices were once again unable to move past a key ceili...
Archive context
Older archive item. Useful for background and entity history, but not a fresh market-moving signal.

Cryptocurrency markets consolidated on Friday, as bulls marginally pulled back following strong gains in yesterday’s session. Bitcoin fell slightly below $24,000, as prices were once again unable to move past a key ceiling. Ethereum was also lower, however continued to trade close to $1,900.
BitcoinBitcoin (BTC) prices fell marginally lower on Friday, as crypto bulls retreated following strong gains during yesterday’s session.
The world’s largest cryptocurrency dropped to an intraday low of $23,828.59 in today’s session, which comes after a high of $24,822.63 the day prior.
Today’s decline came as BTC was unable to sustain a move above its resistance level of $24,600, with bears seemingly reentering at this point.
Looking at the chart, today’s decline coincided with the 14-day relative strength index (RSI) failing to break out of its own ceiling.
This resistance was at the 60.32 level, which last suffered a marginal break on July 19, however a full move above this point hasn’t occurred in over four months.
It seems as though this is the last obstacle in the way preventing bitcoin from surging to and beyond $25,000.
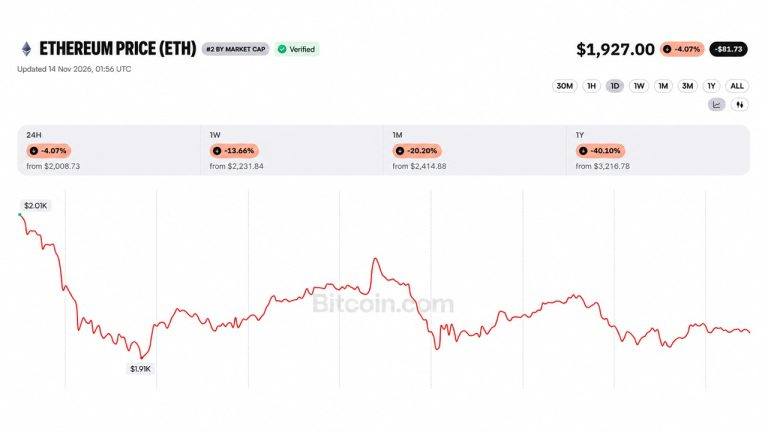
EthereumIn addition to BTC, ethereum (ETH) was also trading slightly lower in today’s session, as prices of the world’s second-largest token moved slightly below $1,900.
Following a high of $1,905.49 on Thursday, ETH/USD moved to a bottom of $1,863.16 in today’s session.
Yesterday’s high was also a key resistance point for ethereum, and was the first time in over two months that prices had collided with this ceiling.
As a result of this, bearish pressure resurfaced, sending the token back below the $1,905 level, which as seen on the chart is a significant point of uncertainty.
Looking at the chart, back on June 7, when ETH last hit this ceiling, prices went on to fall for twelve consecutive sessions, hitting a bottom below $900 in the process.
In addition to this, the RSI has also failed to move beyond its own resistance at 68, which seems to have been a signal to bears to reenter the market.
Register your email here to get weekly price analysis updates sent to your inbox:
Do you expect ethereum to fall lower this weekend? Leave your thoughts in the comments below.
Why this matters
This ethereum story adds another data point to the current market tape and is useful when read alongside nearby source coverage.
Original source
Read on Bitcoin NewsRelated market context

Lithium Market Outlook as $90,650 Spot Meets a Heavy ETF Resistance Wall in Q4
The Global X Lithium and Battery Tech ETF, on the other hand, dropped 2.64% to $59.46. This divergence indicates that there is not...

U.S. Wholesale Inflation Hits 6.5%—What It Means for Bitcoin’s Next Move
Bitcoin’s inflation problem has a fresh complication. U.S. wholesale prices rose 6.5% over the year to October, their fastest annu...

Bitcoin Price Falls 14% in a Week to $65,000 as Weekend Selling Breaks Friday’s Low
Bitcoin Magazine Bitcoin Price Falls 14% in a Week to $65,000 as Weekend Selling Breaks Friday’s Low Bitcoin price crashed about 1...
Ether Price Dips Below $2K as Ethereum Foundation Dumps 5000 ETH in 5 Day
A wallet linked to the Ethereum Foundation sold another 1,000 ETH on Saturday, taking its five-day total to 5,000 ETH, or about $9...

Bitcoin Price Today: Negative Funding Rates Signal Growing Bearish Bets as BTC Nears $68K
The latest data presents a mixed picture, however, as Hyperliquid whales have returned to net-long positions despite deteriorating...

Bitcoin (BTC) Price Today: $65K Support Under Pressure as Glassnode Maps $60K–$62K Liquidation Cluster
Glassnode’s futures liquidation heat map identifies a concentrated cluster of leveraged long positions between $60,000 and $62,000...