Bitcoin, Ethereum Technical Analysis: BTC Moves Below $40,000 on Saturday
Bitcoin fell below $40,000 to start the weekend, as crypto markets continued to be submerged by the latest red wave. ETH was also lower on Saturday, and remained in the red for a second consecutive session. Bitcoin BTC d...
Archive context
Older archive item. Useful for background and entity history, but not a fresh market-moving signal.

Bitcoin fell below $40,000 to start the weekend, as crypto markets continued to be submerged by the latest red wave. ETH was also lower on Saturday, and remained in the red for a second consecutive session.
BitcoinBTC dropped below the $40,000 level to start the weekend, following a three-day losing streak which has pushed price close to multi-week lows.
Following a peak of $40,524.76 on Friday, the world’s largest cryptocurrency fell to a low of $39,315.42 earlier today.
This move is less than 48 hours removed from BTC/USD trading above resistance of $42,500. However, following a false breakout prices have moved back towards support.
The support point on this occasion is the $39,500 floor, where bitcoin started trading this week, before its initial midweek rally.
Ultimately, today’s return to support has been a perfect encapsulation of the current volatility within crypto markets this week, and April in general, where we have mainly seen consolidation.
In addition to this, the 14-day RSI is now tracking at 40.5 which is an area where bullish momentum typically picks up — as such, the possibility of a rebound remains high.
EthereumETH was lower for a fourth consecutive session, as prices once again traded below the $3,000 support level.
As of writing, today’s low sees ETH/USD fall to a bottom of $2,926.74, which comes after a high of $3,007.41 yesterday.
Since this low, which broke past support of $2,950, the world’s second-largest cryptocurrency moved marginally higher, as bulls re-entered.
Typically, we have seen strong bullish pressure at this floor, and so far today this has been the case, with ETH now trading at $2,963.86.
Looking at the chart, the RSI indicator is also hovering close to its own support of 43.50, however if this strength turns to weakness, there could be an even bigger drop in ethereum’s price.
We will now likely see high levels of uncertainty this weekend, as both bulls and bears continue to jockey for positions.
Do you expect ETH to fall further this weekend? Leave your thoughts in the comments below.
Why this matters
This ethereum story adds another data point to the current market tape and is useful when read alongside nearby source coverage.
Original source
Read on Bitcoin NewsRelated market context

Bitcoin (BTC) Price Today: $65K Support Under Pressure as Glassnode Maps $60K–$62K Liquidation Cluster
Glassnode’s futures liquidation heat map identifies a concentrated cluster of leveraged long positions between $60,000 and $62,000...

Bitcoin Price Falls 14% in a Week to $65,000 as Weekend Selling Breaks Friday’s Low
Bitcoin Magazine Bitcoin Price Falls 14% in a Week to $65,000 as Weekend Selling Breaks Friday’s Low Bitcoin price crashed about 1...

Bitcoin Slides Toward $63,000 as Weekend Selling Tests Market Confidence
Bitcoin's latest decline is testing something more important than a round-number price level: whether buyers have enough convictio...

XRP Price Today: $0.98 Support Under Threat Despite Oversold RSI
Deeply oversold indicators suggest a possible relief bounce, but the broader technical structure remains bearish. The XRP price ha...
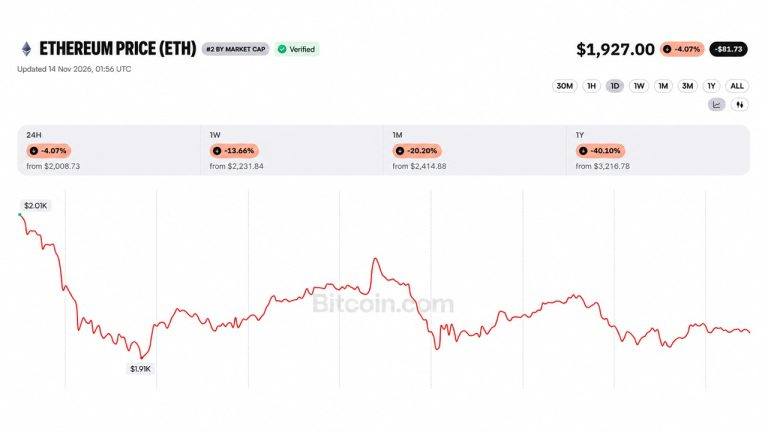
Ether Price Dips Below $2K as Ethereum Foundation Dumps 5000 ETH in 5 Day
A wallet linked to the Ethereum Foundation sold another 1,000 ETH on Saturday, taking its five-day total to 5,000 ETH, or about $9...

Bitcoin drops below $64,000 as bullish bets get wiped out over the weekend
CoinGecko showed BTC near $65,500 on the afternoon of Nov. 14, while Newhedge recorded long-liquidation events below $66,000. Read...