Bitcoin, Ethereum Technical Analysis: BTC Plunges Under $27,000, Hitting 7-Week Low
Bitcoin fell to a seven-week low on May 12, as prices dropped below the $27,000 level in today’s session. Friday’s decline came as a red wave swept through cryptocurrencies, with the market cap down 2.75% as of writing....
Archive context
Older archive item. Useful for background and entity history, but not a fresh market-moving signal.

Bitcoin fell to a seven-week low on May 12, as prices dropped below the $27,000 level in today’s session. Friday’s decline came as a red wave swept through cryptocurrencies, with the market cap down 2.75% as of writing. Ethereum also slipped to its weakest point since March.
BitcoinBitcoin (BTC) dropped below the $27,000 level in today’s session, pushing prices to a seven-week low.
Following a high of $27,589.92 on Thursday, BTC/USD slipped to an intraday bottom at $26,166.87.
As a result of this drop, bitcoin fell to its lowest level since March 17, when price was below the $25,000 mark.
Bitcoin chart by TradingViewOverall, this latest sell-off coincided with the 14-day relative strength index (RSI) breaking out of yesterday’s floor of 43.00.
At the time of writing, price strength is tracking at 35.07, which is its lowest point in over two months.
Should momentum continue in this current trajectory, there is a possibility that BTC could move toward $25,000 this weekend.
EthereumIn addition to BTC, ethereum (ETH) was also in the red on Friday, as bears continued to control market sentiment.
ETH/USD slipped to a low at $1,742.40 on Thursday, following an earlier peak of $1,835.62 the day prior.
Similar to bitcoin, today’s drop in price saw the world’s second largest cryptocurrency hit its lowest point since March.
Ethereum chart by TradingViewA major catalyst to the move was also a breakout on the RSI, which fell out of a support point at the 44.00 zone.
Currently, the index is at a reading of 39.04, which is its weakest level since March 11, when ETH traded below $1,500.
Ultimately, this could be a long-term positive for bulls, who may move to buy the current dip in price.
Register your email here to get weekly price analysis updates sent to your inbox:
What is behind today’s red wave? Leave your thoughts in the comments below.
Why this matters
This ethereum story adds another data point to the current market tape and is useful when read alongside nearby source coverage.
Original source
Read on Bitcoin NewsRelated market context
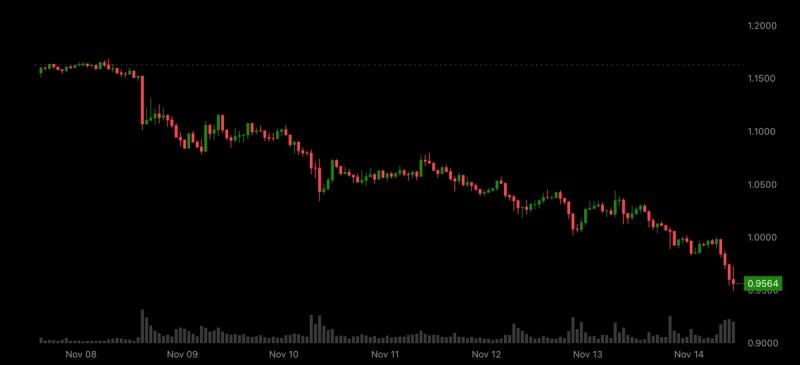
XRP crashes to its lowest since November 2024 as money leaves crypto
XRP tanked to its lowest level since November 2024 as ETF outflows and shrinking stablecoin supply add to pressure on crypto marke...

Bitcoin Price Falls 14% in a Week to $65,000 as Weekend Selling Breaks Friday’s Low
Bitcoin Magazine Bitcoin Price Falls 14% in a Week to $65,000 as Weekend Selling Breaks Friday’s Low Bitcoin price crashed about 1...

U.S. Wholesale Inflation Hits 6.5%—What It Means for Bitcoin’s Next Move
Bitcoin’s inflation problem has a fresh complication. U.S. wholesale prices rose 6.5% over the year to October, their fastest annu...

XRP Price at the $1 Line: Should You Sell or Add More to Your Bag?
XRP is dangerously close to losing the $1 price mark, putting holders in an uncomfortable position. Some holders may see another b...
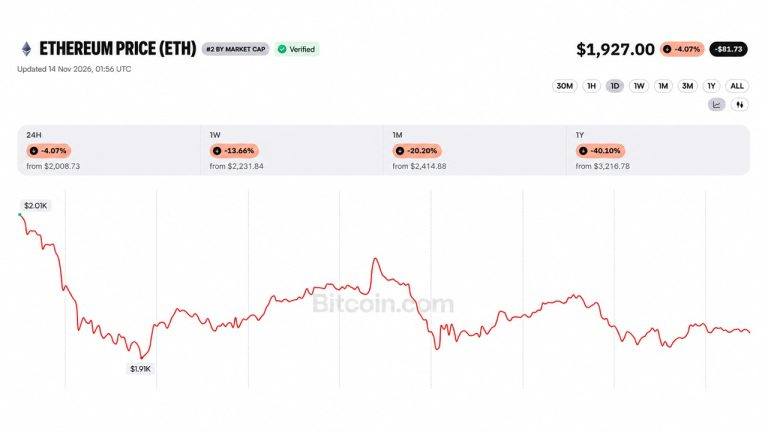
Ether Price Dips Below $2K as Ethereum Foundation Dumps 5000 ETH in 5 Day
A wallet linked to the Ethereum Foundation sold another 1,000 ETH on Saturday, taking its five-day total to 5,000 ETH, or about $9...

Nakamoto Gets Extra Year on 60 Million USDT Kraken Loan; Derivatives Count Toward Collateral
Nakamoto Inc. (NAKA) is a bitcoin treasury company, a public company holding bitcoin as a core asset, and has borrowed against it....