Bitcoin, Ethereum Technical Analysis: BTC Remains Above $40,000 Despite Recent Pullback
Following a rise to a high beyond $41,700 earlier this week, bitcoin’s price has fallen for two consecutive sessions. Despite this, BTC continues to trade above $40,000, whilst ETH continues to hover above $2,800. Bitcoi...
Archive context
Older archive item. Useful for background and entity history, but not a fresh market-moving signal.

Following a rise to a high beyond $41,700 earlier this week, bitcoin’s price has fallen for two consecutive sessions. Despite this, BTC continues to trade above $40,000, whilst ETH continues to hover above $2,800.
Bitcoin
BTC fell for its second consecutive session on Friday, as the world’s largest cryptocurrency has lost some momentum, following Wednesday’s Fed decision.
Yesterday saw bitcoin trade at a peak of $41,102.23, however as of writing, prices have fallen to an intraday low of $40,302.40.
This drop means that BTC/USD is 1.66% lower than Thursday’s high, and comes as prices have fallen back below long-term resistance.
The ceiling, which resides at $40,600, was broken earlier today and this enticed bears to sell even further, due to the historical action which took place there previously.
Looking at the chart, the engulfing bearish candles on March 4 and 10 act as a reminder how quickly gains can be lost, and this lead to some bulls liquidating their positions.
Despite this, the 14-day RSI still remains above 50, which is one of the indications that price strength is still marginally trending upward.
ETH mainly traded above $2,800 on Friday, as prices continued to hover below recent resistance of $2,850.
Following Thursday’s low of $2,774.86, ETH/USD hit a peak of $2,826.16 during today’s session, as moving averages prepared for an upwards cross.
As can be seen from the chart, the 10-day moving average and the 25-day have finally collided, with the short-term average set to overtake mid-term.
Despite recent price volatility, the last seven days have seen ETH climb by an average of 7%, and if moving averages extend this trend, we could see further surges in price.
The only hurdle that remains appears to be the 55.5 ceiling that is currently present in the 14-day RSI.
Will we see the next surge in crypto commence this weekend? Leave your thoughts in the comments below.
Why this matters
This ethereum story adds another data point to the current market tape and is useful when read alongside nearby source coverage.
Original source
Read on Bitcoin NewsRelated market context

XRP Price Today: $0.98 Support Under Threat Despite Oversold RSI
Deeply oversold indicators suggest a possible relief bounce, but the broader technical structure remains bearish. The XRP price ha...

Bitcoin (BTC) Price Today: $65K Support Under Pressure as Glassnode Maps $60K–$62K Liquidation Cluster
Glassnode’s futures liquidation heat map identifies a concentrated cluster of leveraged long positions between $60,000 and $62,000...

Bitcoin Price Today: Negative Funding Rates Signal Growing Bearish Bets as BTC Nears $68K
The latest data presents a mixed picture, however, as Hyperliquid whales have returned to net-long positions despite deteriorating...
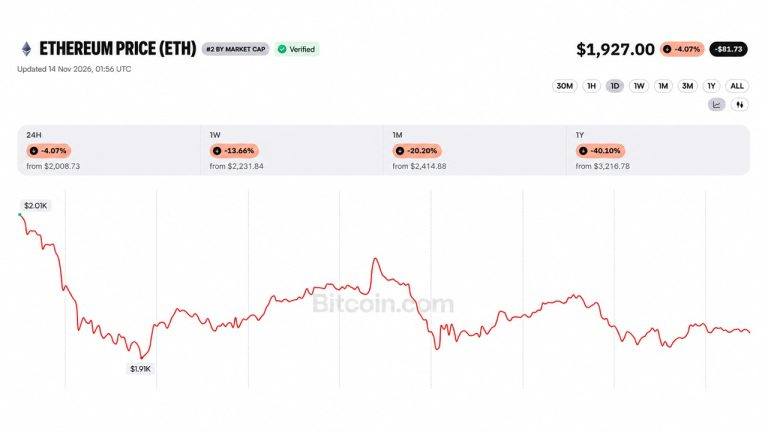
Ether Price Dips Below $2K as Ethereum Foundation Dumps 5000 ETH in 5 Day
A wallet linked to the Ethereum Foundation sold another 1,000 ETH on Saturday, taking its five-day total to 5,000 ETH, or about $9...

Lithium Market Outlook as $90,650 Spot Meets a Heavy ETF Resistance Wall in Q4
The Global X Lithium and Battery Tech ETF, on the other hand, dropped 2.64% to $59.46. This divergence indicates that there is not...

Bitcoin Price Briefly Crashes to $67,500, Lowest Since August, as Dollar Holds 19-Month High
Bitcoin Magazine Bitcoin Price Briefly Crashes to $67,500, Lowest Since August, as Dollar Holds 19-Month High Bitcoin price traded...