Bitcoin, Ethereum Technical Analysis: ETH Below $1,600, BTC Under $21,000 to Start the Week
Ethereum extended recent declines to start the week, as the token briefly fell below a key support point in today’s session. Monday’s sell-off saw the majority of the cryptocurrency top 100 in the red, with the global ma...
Archive context
Older archive item. Useful for background and entity history, but not a fresh market-moving signal.

Ethereum extended recent declines to start the week, as the token briefly fell below a key support point in today’s session. Monday’s sell-off saw the majority of the cryptocurrency top 100 in the red, with the global market cap down 1.61% as of writing. Bitcoin also slipped, once again falling below $21,000.
BitcoinBitcoin (BTC) started the week in the red, as prices of the token dropped following a mini-rally over the weekend.
Less than 24 hours after hitting a high of $21,668.85, BTC/USD slipped to an intraday low of $20,939.18 earlier in the day.
This drop led to bitcoin moving closer to its recent support point of $20,800, which it last hit on Saturday, however bulls have so far resisted a similar occurrence today.
Looking at the chart, earlier bearish momentum has somewhat eased, and as of writing, the token is trading at $21,251.86.
Overall, BTC has fallen lower for seven of the last nine sessions, and this has resulted in a downward cross between the 10-day (red) moving average (MA), and the 25-day (blue) MA.
Although the floor of $20,800 has so far remained firm, should bearish pressure intensify, we will likely see BTC move below $20,000.
EthereumBearish sentiment was also present with ethereum (ETH), as the world’s second-largest cryptocurrency continued to trade below $1,600.
ETH/USD, which was at a high of $1,640.94 on Sunday, fell lower in today’s session, dropping to a bottom of $1,535.01.
Monday’s drop sees ETH remain close to its lowest level since July 27, when prices fell below the $1,500 point.
Focusing on the chart, today’s sell-off comes as the 14-day relative strength index once again moved below its floor at 43.00.
As of writing, the index is tracking at 41.90, which is its weakest reading since July 12, when ETH was trading at $1,065.
Unlike with BTC, the moving averages have yet to cross, however they are currently at their closest proximity since mid-July.
Register your email here to get weekly price analysis updates sent to your inbox:
Will ethereum move below $1,500 in upcoming days? Leave your thoughts in the comments below.
Why this matters
This ethereum story adds another data point to the current market tape and is useful when read alongside nearby source coverage.
Original source
Read on Bitcoin NewsRelated market context

Bitmine’s Ether Stash Passes 6 Million Tokens as Its Weekly Buying Slows
Bitmine Immersion Technologies has crossed 6 million ETH, the Ethereum treasury company said Monday, after buying 17,362 ETH in th...

Quant (QNT) Price Today: QNT Jumps Over 300% in a Week as Tokenized Banking Deal Drives Demand
The sharp move accelerated after The Clearing House selected Quant on September 24 to provide the interoperability, orchestration,...

Chainlink Upgrade Gives Institutions Their Own Sign-Off on Cross-Chain Token Transfers
Chainlink launched CCIP 2.0 on Monday, a new version of its Cross-Chain Interoperability Protocol in which institutions and token...

Bitcoin dips below $83,000 to start the week as Asia markets sell, extending last week’s retreat
Bitcoin slipped below $83,000 during Monday's Asia session, moving beneath the lower edge of the $83,000 to $85,000 range reported...
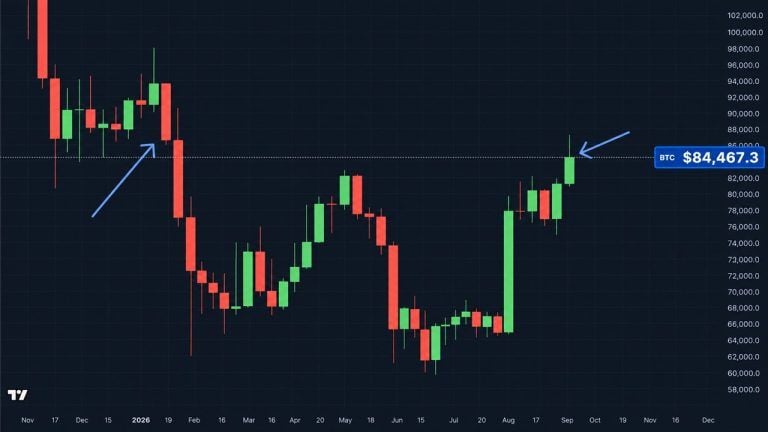
Bitcoin Price Logs Its Best Weekly Close Since January but Then Stumbles
Bitcoin closed the week at $84,467, its highest weekly finish in eight months, and then gave back 1.5% before most of the U.S. wok...

Vitalik Buterin Says Hegota Will Likely Be Ethereum’s Last ‘Normal’ Fork
Ethereum co-founder Vitalik Buterin says the network’s upgrades will change in kind once Hegota ships next year, with each later f...