Bitcoin, Ethereum Technical Analysis: ETH, BTC Volatile as US Inflation Hits 40-Year High
Prices of ethereum and bitcoin were volatile on Thursday, as markets reacted to U.S. inflation data. Bitcoin briefly recaptured the $45,000 level, but sold off after the data was released. Bitcoin Bitcoin started the day...
Archive context
Older archive item. Useful for background and entity history, but not a fresh market-moving signal.

Prices of ethereum and bitcoin were volatile on Thursday, as markets reacted to U.S. inflation data. Bitcoin briefly recaptured the $45,000 level, but sold off after the data was released.
BitcoinBitcoin started the day in the green, hitting the $45,000 mark in the process, however as the U.S. equity session opened, prices weighed, as it was reported that consumer prices had risen to 7.5%.
BTC/USD rose to an intraday high of $45,101.17 earlier in today’s session, as it appeared that bulls were pushing prices up for a second day.
The move saw bitcoin marginally break out of the $44,750 resistance level, however this ceiling held firm, pushing prices to a low of $43,402.81.
This was the third consecutive false break of this resistance, as the bullish pressure from Monday’s session marginally remained throughout the week.
Price strength has also deteriorated, with the 14-day RSI now tracking at 60, which although still being overbought, is below yesterday’s high of 64.
Despite recent volatility, bullish pressure remains, with the moving averages of ten and 25 days still positioned for further upside momentum.
EthereumEthereum was trading at a multi-week high to start the session, however, similar to BTC, prices fell following inflation data.
As of writing, ETH/USD fell to an intraday low of $3,126.64 on Thursday, as a short-term ceiling of $3,270 halted today’s attempted price surge.
This selloff from resistance pushed ETH towards its recent support of $3,022, which is a level it hasn’t hit since Tuesday.
Many who remain bullish will likely maintain positions up until price strength falls below the 56 level on the RSI.
Is today’s drop in ETH only a temporary setback? Leave your thoughts in the comments below.
Why this matters
This ethereum story adds another data point to the current market tape and is useful when read alongside nearby source coverage.
Original source
Read on Bitcoin NewsRelated market context

U.S. Wholesale Inflation Hits 6.5%—What It Means for Bitcoin’s Next Move
Bitcoin’s inflation problem has a fresh complication. U.S. wholesale prices rose 6.5% over the year to October, their fastest annu...

Bitcoin (BTC) Price Today: $65K Support Under Pressure as Glassnode Maps $60K–$62K Liquidation Cluster
Glassnode’s futures liquidation heat map identifies a concentrated cluster of leveraged long positions between $60,000 and $62,000...

XRP Price Today: $0.98 Support Under Threat Despite Oversold RSI
Deeply oversold indicators suggest a possible relief bounce, but the broader technical structure remains bearish. The XRP price ha...

Bitcoin drops below $64,000 as bullish bets get wiped out over the weekend
CoinGecko showed BTC near $65,500 on the afternoon of Nov. 14, while Newhedge recorded long-liquidation events below $66,000. Read...
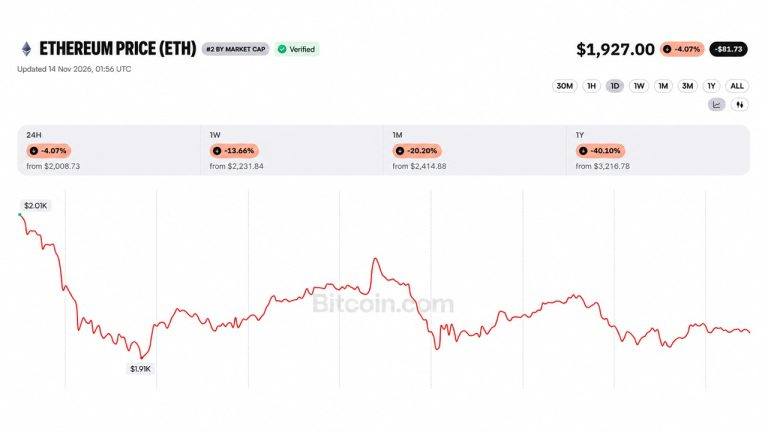
Ether Price Dips Below $2K as Ethereum Foundation Dumps 5000 ETH in 5 Day
A wallet linked to the Ethereum Foundation sold another 1,000 ETH on Saturday, taking its five-day total to 5,000 ETH, or about $9...

Bitcoin Price Falls 14% in a Week to $65,000 as Weekend Selling Breaks Friday’s Low
Bitcoin Magazine Bitcoin Price Falls 14% in a Week to $65,000 as Weekend Selling Breaks Friday’s Low Bitcoin price crashed about 1...