Bitcoin, Ethereum Technical Analysis: ETH Lower, as USD Gains Following Strong Q3 Earnings
Ethereum was back below the $1,300 level on Wednesday, as the U.S. dollar rose following better than expected quarterly earnings. So far this earnings season, Netflix, Bank of America, and others have outperformed expect...
Archive context
Older archive item. Useful for background and entity history, but not a fresh market-moving signal.

Ethereum was back below the $1,300 level on Wednesday, as the U.S. dollar rose following better than expected quarterly earnings. So far this earnings season, Netflix, Bank of America, and others have outperformed expectations, highlighting what some view as the resilience of the U.S. economy, despite the global slowdown. Bitcoin was also back in the red.
BitcoinBitcoin (BTC) was trading lower on Wednesday, as prices continued to decline following a failed breakout of a resistance at $19,550.
Following a high of $19,655.75 on Tuesday, which saw BTC/USD move past the aforementioned ceiling, prices slipped to a low of $19,144.77 earlier today.
Wednesday’s drop sees the token move closer to a breakout below $19,000, with bears likely targeting a floor of $18,900.
Bearish sentiment has largely been present during what many are calling “red October,” with BTC trading below $20,000 for the majority of the month thus far.
Looking at the chart, the 10-day (red) moving average has extended its downward cross with the 25-day (blue), which could be a sign of further declines to come.
In addition to this, the 14-day relative strength index (RSI) is tracking at 45.50, on its way to a floor at the 44.00 point.
EthereumLike BTC, ethereum (ETH) fell for a second consecutive day, as the token moved below the $1,300 level.
Earlier in yesterday’s session, the token was trading above a ceiling of $1,330, however after failing to sustain a breakout, bears reentered the market.
The world’s second largest cryptocurrency fell to an intraday low of $1,291.66, a day removed from hovering at a high of $1,332.49.
As can be seen from the chart, today’s decline in ETH comes as the 14-day RSI continued to fall from its own ceiling of 46.80.
Currently, the index is tracking at 43.47, with the next visible point of support close to the 36.00 region.
Should price strength continue to deteriorate, we could soon see ethereum move further into bearish territory.
Register your email here to get weekly price analysis updates sent to your inbox:
Could we see ethereum fall below $1,300 this week? Leave your thoughts in the comments below.
Why this matters
This ethereum story adds another data point to the current market tape and is useful when read alongside nearby source coverage.
Original source
Read on Bitcoin NewsRelated market context

XRP Price at the $1 Line: Should You Sell or Add More to Your Bag?
XRP is dangerously close to losing the $1 price mark, putting holders in an uncomfortable position. Some holders may see another b...
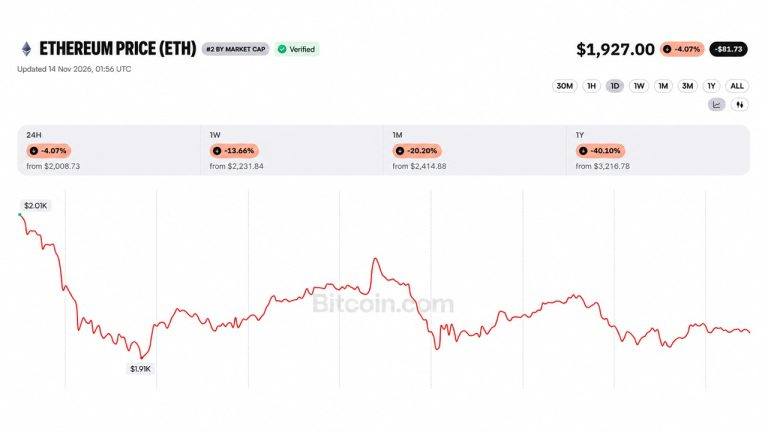
Ether Price Dips Below $2K as Ethereum Foundation Dumps 5000 ETH in 5 Day
A wallet linked to the Ethereum Foundation sold another 1,000 ETH on Saturday, taking its five-day total to 5,000 ETH, or about $9...

U.S. Wholesale Inflation Hits 6.5%—What It Means for Bitcoin’s Next Move
Bitcoin’s inflation problem has a fresh complication. U.S. wholesale prices rose 6.5% over the year to October, their fastest annu...

Ethereum Gas Fees: From Wallet Estimate to Final Cost
Gas measures computational work. A real Ethereum transaction shows why a spending ceiling can exceed the fee finally charged.... R...

Bitcoin (BTC) Price Today: $65K Support Under Pressure as Glassnode Maps $60K–$62K Liquidation Cluster
Glassnode’s futures liquidation heat map identifies a concentrated cluster of leveraged long positions between $60,000 and $62,000...

Bitcoin Falls, DTCC Chooses Solana for Tokenization Expansion, and More – Weekly Recap
This week’s stories centered on market stress, corporate investing, hardware-wallet security, tokenization and prediction markets....