Bitcoin, Ethereum Technical Analysis: ETH Nears $1,500 Level to Start the Weekend
Ethereum neared a breakout below $1,500 to start the weekend, pushing prices closer to a one-month low. Overall sentiment remained mostly bearish, with the global cryptocurrency market cap trading 0.96% lower, as of writ...
Archive context
Older archive item. Useful for background and entity history, but not a fresh market-moving signal.

Ethereum neared a breakout below $1,500 to start the weekend, pushing prices closer to a one-month low. Overall sentiment remained mostly bearish, with the global cryptocurrency market cap trading 0.96% lower, as of writing. Bitcoin also edged lower, with prices remaining below $22,000.
BitcoinBitcoin (BTC) continued its downward descent on Saturday, as prices continued to hover near a three-week low.
Following a high of $21,919.33 on Friday, BTC/USD bottomed out at a low of $21,539.39 earlier in the day.
This drop sees the world’s largest cryptocurrency continue to trade near its lowest point since January 20.
Looking at the chart, prices have since rebounded, which comes as the 14-day relative strength index (RSI) moved away from a recent floor at 42.00
As of writing, the index is currently tracking at 46.35, with the next visible resistance level at the 50.00 mark.
However, momentum appears to be mostly bearish, with the 10-day (red) moving average (MA) approaching a downwards cross with its 25-day (blue) counterpart.
EthereumEtheruem (ETH) fell deeper into bearish territory on Saturday, nearing a one-month low in the process.
ETH/USD fell to an intraday low of $1,504.83 to start the weekend, which comes after failing to stay above an interim floor at $1,550.
As a result of today’s drop, ethereum was trading at its weakest point since mid-January, when it dropped to a low of $1,449.
Like with bitcoin, this recent shift in sentiment has pushed moving averages lower, with the 10-day (MA) losing all previous upwards momentum.
In addition to this, the RSI continues to track below a support point of 47.00, and instead hover at a six-week low of 45.43.
As of writing, ETH is slightly higher, and currently tracking at $1,523.17, however if it fails to climb beyond the 47.00 zone, prices could move lower.
Register your email here to get weekly price analysis updates sent to your inbox:
What is behind this recent shift in market momentum? Leave your thoughts in the comments below.
Why this matters
This ethereum story adds another data point to the current market tape and is useful when read alongside nearby source coverage.
Original source
Read on Bitcoin NewsRelated market context

Bitcoin Price Today: Negative Funding Rates Signal Growing Bearish Bets as BTC Nears $68K
The latest data presents a mixed picture, however, as Hyperliquid whales have returned to net-long positions despite deteriorating...

Bitcoin Price Falls 14% in a Week to $65,000 as Weekend Selling Breaks Friday’s Low
Bitcoin Magazine Bitcoin Price Falls 14% in a Week to $65,000 as Weekend Selling Breaks Friday’s Low Bitcoin price crashed about 1...

Bitcoin Price Briefly Crashes to $67,500, Lowest Since August, as Dollar Holds 19-Month High
Bitcoin Magazine Bitcoin Price Briefly Crashes to $67,500, Lowest Since August, as Dollar Holds 19-Month High Bitcoin price traded...
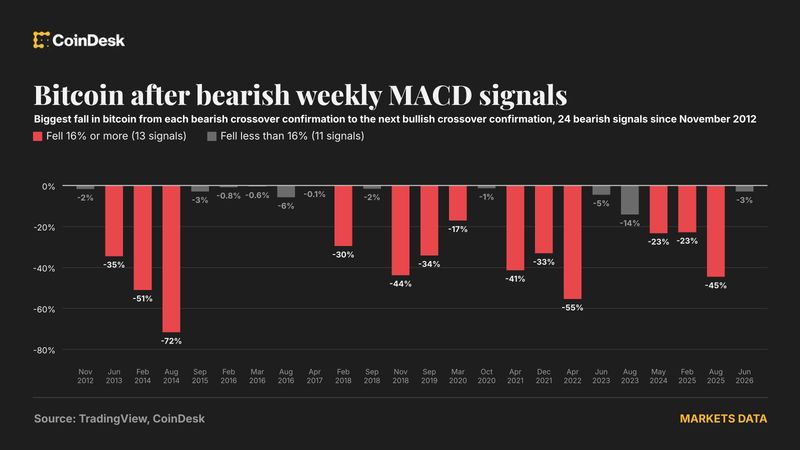
Bitcoin's momentum gauge is turning red, could send prices back below $60,000
Your day-ahead look for Nov. 13, 2026

Bitcoin drops below $64,000 as bullish bets get wiped out over the weekend
CoinGecko showed BTC near $65,500 on the afternoon of Nov. 14, while Newhedge recorded long-liquidation events below $66,000. Read...

XRP Price Today: $0.98 Support Under Threat Despite Oversold RSI
Deeply oversold indicators suggest a possible relief bounce, but the broader technical structure remains bearish. The XRP price ha...