Bitcoin, Ethereum Technical Analysis: ETH Slips Below $1,100 Ahead of FOMC Minutes Report
Ethereum fell below $1,100 on Nov. 22, ahead of tomorrow’s much anticipated United States Federal Open Market Committee (FOMC) minutes release. Many are looking toward this report for hints from the U.S. Federal Reserve,...
Archive context
Older archive item. Useful for background and entity history, but not a fresh market-moving signal.

Ethereum fell below $1,100 on Nov. 22, ahead of tomorrow’s much anticipated United States Federal Open Market Committee (FOMC) minutes release. Many are looking toward this report for hints from the U.S. Federal Reserve, in terms of when it could pivot from current policy. Bitcoin was also lower, hitting a key support point in the process.
BitcoinBitcoin (BTC) continued to trade lower on Tuesday, as crypto markets were nervy ahead of Wednesday’s FOMC minutes release.
BTC/USD fell to a low of $15,599.05 in today’s session, which comes less than 24 hours after hitting a high of $16,246.61.
The move pushed the world’s largest cryptocurrency to its lowest point in two years, and came as prices fell below a key support point.
Looking at the chart, BTC moved marginally below a floor of $15,600 on Tuesday, before rebounding higher as the session matured.
As of writing, bitcoin is trading at $15,784.68, with the 14-day relative strength index (RSI) tracking at 31.61.
This is slightly above a support of 30.50, which means that there could still be upcoming drops in BTC in the coming days.
EthereumEthereum (ETH) fell for a third consecutive session on Tuesday, with the token moving below $1,100 in the process.
Following a high of $1,140.70, ETH/USD declined earlier today, moving to an intraday low of $1,081.14.
As a result of today’s drop in price, ETH sank towards a floor of $1,080, hitting its lowest point since November 4.
Since hitting this point of support prices have somewhat rebounded, and as of writing the token is trading at $1,095.29.
Unlike with BTC, it appears as ETH has found a floor on the RSI indicator, with the index hovering close to a support at 33.00.
Should this floor hold firm, bulls will likely prepare to return to the market, leading to a shift in current sentiment.
Register your email here to get weekly price analysis updates sent to your inbox:
Do you expect ethereum to have any further lower lows this week? Leave your thoughts in the comments below.
Why this matters
This ethereum story adds another data point to the current market tape and is useful when read alongside nearby source coverage.
Original source
Read on Bitcoin NewsRelated market context

XRP Price Today: $0.98 Support Under Threat Despite Oversold RSI
Deeply oversold indicators suggest a possible relief bounce, but the broader technical structure remains bearish. The XRP price ha...
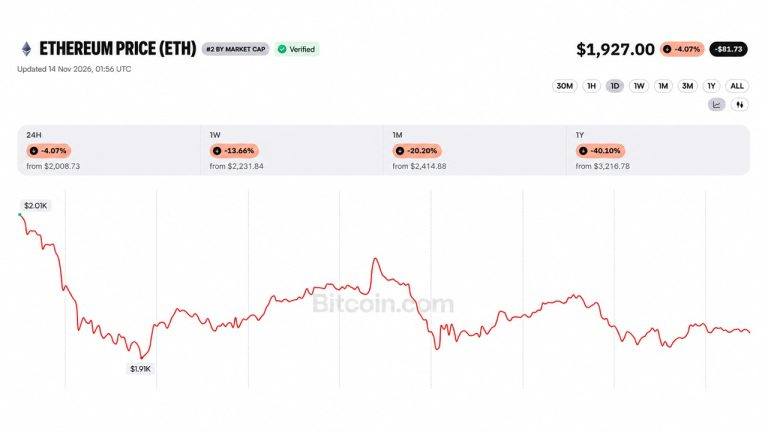
Ether Price Dips Below $2K as Ethereum Foundation Dumps 5000 ETH in 5 Day
A wallet linked to the Ethereum Foundation sold another 1,000 ETH on Saturday, taking its five-day total to 5,000 ETH, or about $9...

Bitcoin (BTC) Price Today: $65K Support Under Pressure as Glassnode Maps $60K–$62K Liquidation Cluster
Glassnode’s futures liquidation heat map identifies a concentrated cluster of leveraged long positions between $60,000 and $62,000...

Bitcoin Price Falls 14% in a Week to $65,000 as Weekend Selling Breaks Friday’s Low
Bitcoin Magazine Bitcoin Price Falls 14% in a Week to $65,000 as Weekend Selling Breaks Friday’s Low Bitcoin price crashed about 1...

Ethereum Dancing on Two Fronts as Quantum Upgrade Advances and Treasury Leverage Bites
Ethereum developers want to upgrade the network to be quantum-ready by 2027, potentially accelerating one of its biggest security...

Lithium Market Outlook as $90,650 Spot Meets a Heavy ETF Resistance Wall in Q4
The Global X Lithium and Battery Tech ETF, on the other hand, dropped 2.64% to $59.46. This divergence indicates that there is not...