Ethereum 'falling knife' warning: Is another 30% crash versus Bitcoin coming?
Ethereum’s native token, Ether (ETH), has dropped to its multi-year lows against Bitcoin (BTC), prompting analysts to predict further declines in the coming weeks.Falling knife warning furthers sell-off risks On March 13...
Archive context
Older archive item. Useful for background and entity history, but not a fresh market-moving signal.

Ethereum’s native token, Ether (ETH), has dropped to its multi-year lows against Bitcoin (BTC), prompting analysts to predict further declines in the coming weeks.
Falling knife warning furthers sell-off risksOn March 13, ETH/BTC—a pair that tracks Ether’s strength against Bitcoin—dropped by over 1.50% to reach $0.022, its lowest level since May 2020.
ETH’s descent is part of its multi-year downtrend that started when it established a record high of $0.156 in June 2017. Since then, it has plunged by more than 85%, underscoring Ether’s growing weakness against Bitcoin.
Meanwhile, on the two-week ETH/BTC chart, the relative strength index (RSI), a momentum indicator used to measure whether an asset is overbought or oversold, has fallen to a record low of 23.32.
ETH/BTC two-week price chart. Source: TradingView
Typically, when RSI drops below 30, it signals oversold conditions, potentially leading to a price rebound.
However, in Ethereum’s case, RSI has continued to plunge even lower even two months after becoming oversold, suggesting that ETH’s downtrend is still accelerating rather than stabilizing.
Crypto analyst Alessandro Ottaviani has described the situation as a “falling knife” scenario—a term used to describe an asset that is experiencing a rapid and steep decline, often discouraging buyers from stepping in too soon.
A falling knife implies that attempting to catch the asset at a perceived low could lead to further losses if the downtrend persists.
For Ethereum to signal a potential reversal, traders will be watching for RSI stabilization and reclaim of key resistance levels. That ideally begins with a rebound from the 0.022 BTC level, which had limited ETH/BTC’s downside attempts in December 2020, leading to a 300% rally.
ETH/BTC weekly price chart. Source: TradingView
Should a rebound happen, the ETH/BTC pair can rally toward its 0.382 Fibonacci retracement line at around 0.038 BTC, aligning with the 50-week exponential moving average (50-week EMA; the red wave).
Until then, the technical outlook suggests that ETH/BTC could remain trapped in its falling knife trajectory, with the next potential downside targets at historical support levels inside the 0.020-0.016 BTC range.
ETH/BTC two-week price chart. Source: TradingView
The lowest point of this range is approximately 30% below the current price levels.
ETH/BTC fundamentals support a bearish outlookEther’s prospects of declining further against Bitcoin are rooted in factors beyond technical analysis.
For instance, Ethereum currently faces strong competition from rival layer-1 blockchains, namely Solana (SOL).
Related: 'The worst thing that happened to Ethereum' — Bitcoin up 160% since the Merge
VanEck noted that Solana’s decentralized exchange volume has surpassed Ethereum’s even during a steep dropoff in memecoin trading activity. Meanwhile, Solana’s volume has risen consistently in recent months, which coincides with a decline in Ethereum’s volumes.
Solana vs. Ethereum DEX volumes. Source: VanEck
Furthermore, the launch of spot Bitcoin ETFs has fundamentally altered the traditional crypto market cycle that used to benefit Ethereum and other altcoins.
Historically, after Bitcoin surged post-halving, capital rotated into altcoins, triggering an “altseason” where ETH and other assets outperformed BTC. However, the $129 billion inflows into Bitcoin ETFs in 2024 have disrupted this cycle, draining liquidity from the broader altcoin market—including Ethereum.
Bitcoin Dominance Index weekly price chart. Source: TradingView
Another factor is Ethereum-specific selling pressure.
The recent Bybit hack reportedly led to substantial ETH liquidations, with some of that value laundered via decentralized platforms like Thorchain. This absorbed sell-off may still be rippling through the market, depressing ETH’s relative value.
This article does not contain investment advice or recommendations. Every investment and trading move involves risk, and readers should conduct their own research when making a decision.
Why this matters
This ethereum story adds another data point to the current market tape and is useful when read alongside nearby source coverage.
Original source
Read on CointelegraphRelated market context

Solana flips Ethereum in fees, while ETH holds the burn lead
Solana generated more user fees than Ethereum in data provider DefiLlama's Sept. 22 dashboard snapshot, while Ethereum burned more...

ETH USD Loses Ground as Ethereum Price Analysis Remains Targeting $3,000 This Week
Ethereum Price Prediction, September 23: Ethereum (ETH) trades at $2,735, down a marginal 0.61% over the past 24 hours, a pause, n...

Cloudflare Exec Says Ethereum’s Original Sharding Plan Could Work for Stablecoin Payments
Will Papper, Cloudflare‘s director of product for agent payments, said a blockchain split into parallel shard chains, the design E...

Ethereum ETFs Pull In $270M As BlackRock Leads September 21 Rebound
TL;DR US spot Ethereum ETFs recorded $270.0 million of net inflows for the September 21 session. BlackRock’s ETHA led the day with...
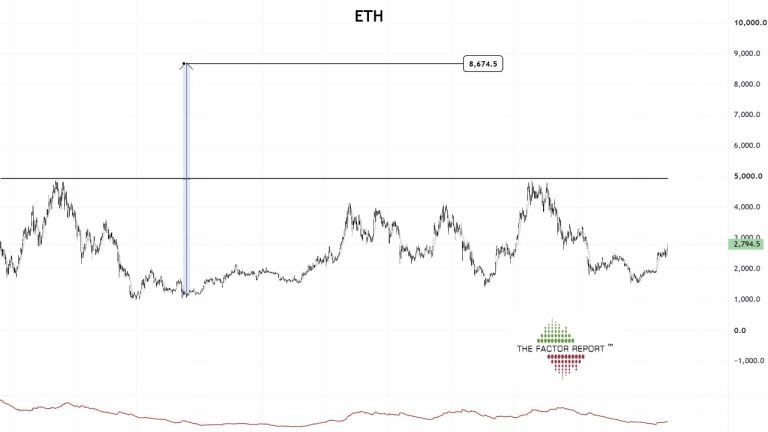
Peter Brandt Sees Ethereum at $8,600 if ETH Clears $5,000
Ethereum could eventually reach $8,600 if it first clears $5,000, according to a long-term chart posted by veteran trader Peter Br...

Bitcoin and Ethereum ETFs pull in $877M in a single day as institutional appetite surges
The surge in institutional investments in crypto ETFs signals growing mainstream acceptance and could drive further market stabili...