Ethereum Bearish Falling Wedge Pattern Appears, How Low Can Price Go?
Ethereum has followed the general trend of Bitcoin over the last few weeks and when the asset dipped from its 2023 peak, so did the price of ETH. Following this decline in price, a worrying pattern has appeared on the ET...
Archive context
Older archive item. Useful for background and entity history, but not a fresh market-moving signal.

Ethereum has followed the general trend of Bitcoin over the last few weeks and when the asset dipped from its 2023 peak, so did the price of ETH. Following this decline in price, a worrying pattern has appeared on the ETH chart known as a falling wedge pattern. This was brought to light by crypto analyst Alan Santana, who has painted a grim picture of what this could mean for Ethereum.
Ethereum Falling Wedge Pattern Is BearishIn the analysis posted on the TradingView website, Alan Santana explains that the appearance of this falling wedge pattern does not bode well for the Ethereum price. Apparently, the ETH chart had formed a perfect rising wedge which eventually broke bearish. Given this, the crypto analyst explains that it shows that the Ethereum price is moving alongside the rest of the crypto market in a “normal but fast correction.”
The crypto analyst also backs up their analysis with the Ethereum Moving Average Convergence/Divergence (MACD) indicator. In the chart shared by the analyst, there is a clear decline in the MACD on the daily chart, which lends credence to the bearish pressure mounting on ETH.
Furthermore, using the Relative Strength Index (RSI) on the daily chart as well, there is also a clear decline. The RSI has apparently already lost its trend line support and is now moving below 50. The simple fact suggests a turn toward the bearish direction for the cryptocurrency.
Santana explains that these indicators show that the bias toward a downward spiral is strong, especially since it has already seen a double-top pattern. “Volume continues to drop, the calm before the storm. Slowly, slowly down… Nothing is happening, everything is good then Boom!” the analyst warns.
Price Targets For ETH’s Bearish FormationFrom the chart posted in the analysis, the crypto analyst seems to expect at least a 20% drawdown for Ethereum following the double-top formation. Now, the chart puts the double top formation when the asset’s price briefly touched the $2,400 level last week.
After that, expectations have quickly gone in the opposite direction and as the formation plays out, the crypto analyst sees a decline to at least $1,800 from here. If further downside follows, then Santana expects that there will be more drawdowns that will end somewhere around $1,600.
The Ethereum price is still trending around $2,200 at the time of writing, suggesting the bear pressure is still mounting. If it breaks down from here, then Santana’s prediction could prove right and ETH’s price could fall back to mid-October levels.
Why this matters
This ethereum story adds another data point to the current market tape and is useful when read alongside nearby source coverage.
Original source
Read on NewsBTCRelated market context

Ethereum Price Prediction: ETH Finally Breaks the Bear Pattern
Ethereum price trades at $2,675 after clearing a bull-flag structure that had capped its bullish prediction for weeks. The breakou...

Elon Musk Grok AI Predicts a Bold Move for Ethereum in 2026
When prompted, the Elon Musk-backed Grok AI predicts a bold move for Ethereum (ETH) over the remainder of 2026. It claims that if...

Ethereum (ETH) Price Prediction: Bulls and Bears Face Off as $3,000 Rally Meets Liquidation Risk
Ethereum price is entering a volatile phase after its latest recovery, with buyers trying to defend the recent breakout while sell...
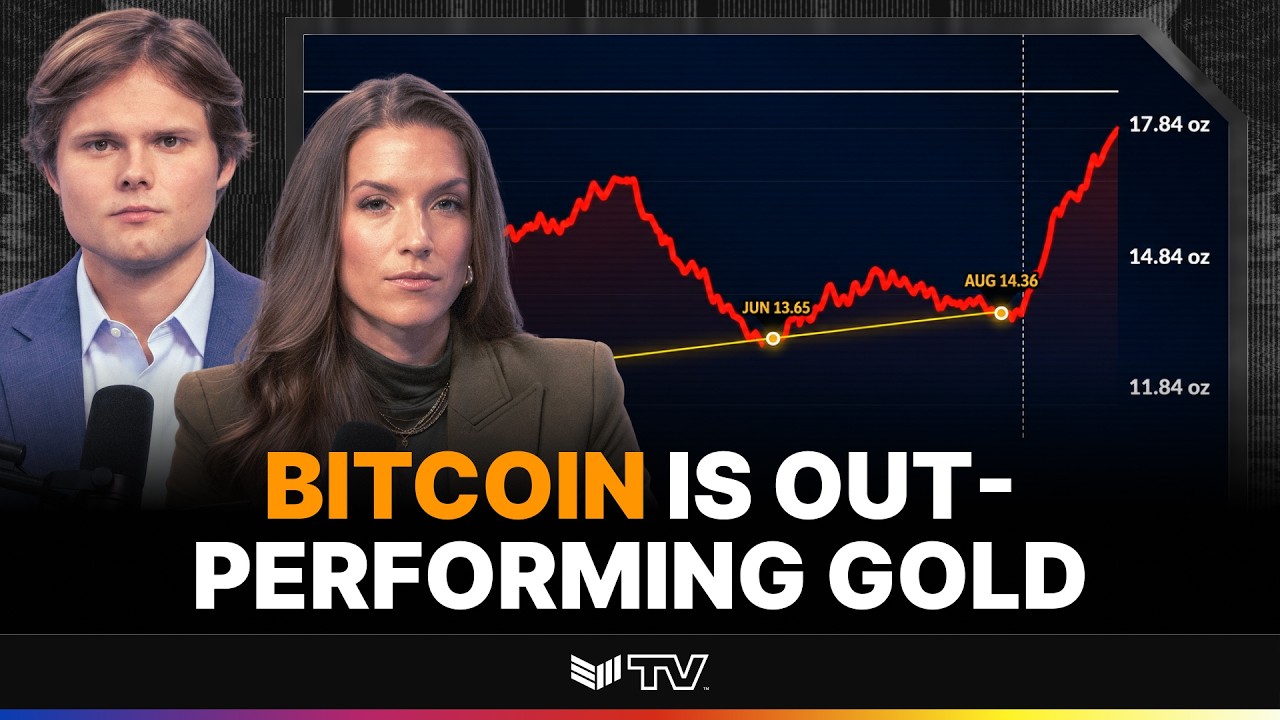
TECHNICAL ANALYSIS: BTC to Cross Key Price Level Against Gold
Bitcoin Magazine TECHNICAL ANALYSIS: BTC to Cross Key Price Level Against Gold The 90-day correlation between Bitcoin and gold jus...

Mitchell Askew Explains What 15M Inactive BTC Means for Bitcoin’s Next Move
Bitcoin Magazine Mitchell Askew Explains What 15M Inactive BTC Means for Bitcoin’s Next Move Bitcoin is rallying despite a Fed rat...

XRP Price Prediction: Weekly Gains Lead Crypto Market, But Can XRP Clear $1.63?
XRP price trades at $1.53, up by a marginal 1.5% on the day, and is still sitting on one of the strongest weekly charts among larg...