Ethereum Bulls Keeps Pushing, Why Rally Isn’t Over Yet
Ethereum price rallied steadily and surpassed the $2,000 resistance. ETH is consolidating above $2,000 and might start a fresh increase toward $2,120. Ethereum rallied above the $2,000 and $2,050 levels before it correct...

Ethereum price rallied steadily and surpassed the $2,000 resistance. ETH is consolidating above $2,000 and might start a fresh increase toward $2,120.
- Ethereum rallied above the $2,000 and $2,050 levels before it corrected lower.
- The price is trading above $2,020 and the 100-hourly Simple Moving Average.
- There is a key declining channel forming with support near $2,000 on the hourly chart of ETH/USD (data feed via Kraken).
- The pair could start a fresh increase if it clears the $2,085 resistance zone in the near term.
This past week, we saw a strong increase in Ethereum above the $2,000 level. ETH outperformed Bitcoin and cleared many hurdles near the $2,050 level.
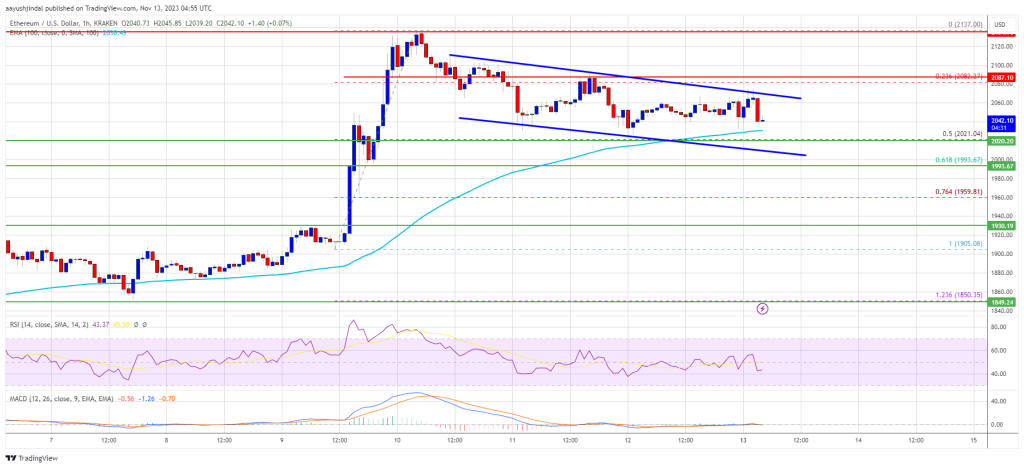
It traded to a new multi-week high at $2,137 before there was a downside correction. The price declined below the $2,080 level. There was a move below the 23.6% Fib retracement level of the upward move from the $1,906 swing low to the $2,137 high.
Ethereum is still trading above $2,020 and the 100-hourly Simple Moving Average. There is also a key declining channel forming with support near $2,000 on the hourly chart of ETH/USD.
Source: ETHUSD on TradingView.com
On the upside, the price is facing resistance near the $2,060 level and the channel region. The next major resistance sits at $2,085, above which the price could accelerate higher. In the stated case, the price could rally toward the $2,120 resistance. The next key resistance is near $2,150, above which the price could aim for a move toward the $2,200 level.
More Losses in ETH?If Ethereum fails to clear the $2,085 resistance, it could continue to move down. Initial support on the downside is near the $2,025 level and the 100-hourly Simple Moving Average. It is close to the 50% Fib retracement level of the upward move from the $1,906 swing low to the $2,137 high.
The next key support is $2,000 and the channel zone. A downside break below the $2,000 support might spark bearish moves. In the stated case, Ether could drop toward the $1,930 support zone in the near term. Any more losses might call for a drop toward the $1,850 level.
Technical Indicators
Hourly MACD – The MACD for ETH/USD is losing momentum in the bearish zone.
Hourly RSI – The RSI for ETH/USD is now below the 50 level.
Major Support Level – $2,000
Major Resistance Level – $2,085
Original source
Read on NewsBTCRelated market context

Tether USDT Briefly Overtakes Ethereum in Market Cap: A $187B Wake-Up Call
For a few hours, earlier this week, Tether USDT stablecoin held a higher market cap than Ethereum, the first time that has happene...

Uranium Holds Above $85 as Mining ETF Rebounds From June Sell-Off
The latest charts display that the market is divided into stable physical prices and uranium shares trying to regain momentum afte...

Standard Chartered Says Bitcoin Bottomed Near $59,000 As Crypto Winter Ends
TL;DR Standard Chartered’s Geoffrey Kendrick reportedly says Bitcoin’s $59,000 area marked the cycle bottom. The note cites SpaceX...

Google Gemini AI Predicts Jaw-Dropping XRP Price For Next 90 Days
Google Gemini AI just put XRP back under the spotlight, predicting it is tightly wound for a major breakout toward $1.60 to $1.80...

Bitcoin price challenges $64,000 weekend wall – needing a breakout or risk a deeper correction
Bitcoin reclaimed $64,000 on June 12 and touched an intraday high of $64,301 in the same session that spot ETF flows finally flipp...

Elon Musk SpaceX AI Predicts Incredible Bitcoin Price For Next 30 Days
Here is the thing about capitulation calls. They only sound smart in hindsight. Right now, with Bitcoin price scraping along the l...