Ethereum Bulls Set Sights on $3K: Is a Breakout Coming?
Ethereum price started a steady increase above the $2,650 resistance. ETH is beating Bitcoin and might even rally toward the $3,000 resistance zone. Ethereum started a fresh increase above the $2,580 and $2,650 levels. T...

Ethereum price started a steady increase above the $2,650 resistance. ETH is beating Bitcoin and might even rally toward the $3,000 resistance zone.
- Ethereum started a fresh increase above the $2,580 and $2,650 levels.
- The price is trading above $2,670 and the 100-hourly Simple Moving Average.
- There is a key contracting triangle forming with support at $2,670 on the hourly chart of ETH/USD (data feed via Kraken).
- The pair could extend gains if it clears the $2,750 resistance zone.
Ethereum price started a decent increase from the $2,520 support zone. ETH outperformed Bitcoin and surpassed the $2,650 resistance zone. The price even spiked above the $2,720 zone.
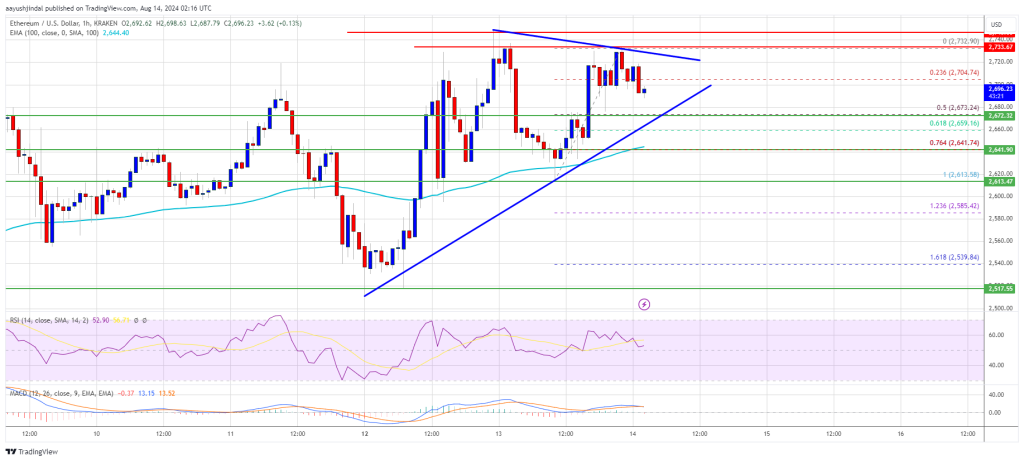
The recent swing high was formed at $2,732 and the price is now consolidating gains. The price is now moving lower below the $2,700 level. There was a drop below the 23.6% Fib retracement level of the upward move from the $2,613 swing low to the $2,732 high.
Ethereum price is now trading above $2,670 and the 100-hourly Simple Moving Average. There is also a key contracting triangle forming with support at $2,670 on the hourly chart of ETH/USD. The triangle support is near the 50% Fib retracement level of the upward move from the $2,613 swing low to the $2,732 high.
If there is another increase, the price might face hurdles near the $2,720 level. The first major resistance is near the $2,750 level. A close above the $2,750 level might send Ether toward the $2,820 resistance.
The next key resistance is near $2,880. An upside break above the $2,880 resistance might send the price higher toward the $3,000 resistance zone in the near term.
Another Drop In ETH?If Ethereum fails to clear the $2,720 resistance, it could slowly move down. Initial support on the downside is near $2,670 and the triangle’s trend line. The first major support sits near the $2,640 zone and the 100 hourly SMA.
A clear move below the $2,640 support might push the price toward $2,620. Any more losses might send the price toward the $2,550 support level in the near term. The next key support sits at $2,520.
Technical Indicators
Hourly MACD – The MACD for ETH/USD is losing momentum in the bullish zone.
Hourly RSI – The RSI for ETH/USD is now above the 50 zone.
Major Support Level – $2,670
Major Resistance Level – $2,750
Original source
Read on NewsBTCRelated market context

Uranium Holds Above $85 as Mining ETF Rebounds From June Sell-Off
The latest charts display that the market is divided into stable physical prices and uranium shares trying to regain momentum afte...

Tether USDT Briefly Overtakes Ethereum in Market Cap: A $187B Wake-Up Call
For a few hours, earlier this week, Tether USDT stablecoin held a higher market cap than Ethereum, the first time that has happene...

Standard Chartered Says Bitcoin Bottomed Near $59,000 As Crypto Winter Ends
TL;DR Standard Chartered’s Geoffrey Kendrick reportedly says Bitcoin’s $59,000 area marked the cycle bottom. The note cites SpaceX...

Elon Musk SpaceX AI Predicts Incredible Bitcoin Price For Next 30 Days
Here is the thing about capitulation calls. They only sound smart in hindsight. Right now, with Bitcoin price scraping along the l...

Michael Saylor says investor confidence in Ethereum has collapsed
Ethereum's declining investor confidence signals a shift towards Bitcoin dominance, emphasizing real-world utility over speculativ...

Elon Musk’s trillionaire status puts his net worth above crypto’s entire market cap outside Bitcoin
Elon Musk has become the first person in modern history to amass a personal net worth exceeding $1 trillion, crossing the historic...