Ethereum Could Decline To $1,700 Based On This Pattern, Analyst Explains
An analyst has explained how a pattern forming in the 3-day Ethereum chart could signal that a decline toward $1,700 may be coming. Ethereum Has Recently Formed A TD Sequential Sell Setup In a new post on X, analyst Ali...
Archive context
Older archive item. Useful for background and entity history, but not a fresh market-moving signal.

An analyst has explained how a pattern forming in the 3-day Ethereum chart could signal that a decline toward $1,700 may be coming.
Ethereum Has Recently Formed A TD Sequential Sell SetupIn a new post on X, analyst Ali talked about a sell signal that has taken shape in the ETH 3-day chart. The relevant technical indicator here is the “Tom Demark (TD) Sequential,” which is used to spot reversals in the price of any asset.
The metric is made up of two phases; a setup phase and a countdown phase. In the former, candles of the same polarity are counted up to nine following a reversal in the price. Once the ninth candle is hit, the indicator signals a probable top or bottom for the asset (depending on whether the trend until now was towards up or down).
Once the setup is completed, the 13-candle-long countdown phase begins. At the end of these 13 candles, a potential reversal once again takes place for the asset.
Ethereum has registered a sharp rally recently, but according to the analyst, the cryptocurrency has now finished with the setup phase of the indicator, implying that the asset could be heading towards a period of downtrend.
The below chart shows this pattern in the 3-day price of the coin:
In the same chart, the analyst has drawn an ascending triangle pattern for Ethereum. “Ascending triangles” are made up of two lines: one parallel to the x-axis drawn through the highs in the price, while the other is made by connecting higher lows.
Generally, the price feels resistance at the upper line and support at the lower one. A break out of either of these lines suggests a continuation of the trend: bullish in the case of a surge above the former, while bearish in the case of the latter.
From the graph, it’s visible that Ethereum has recently been retesting the $2,000 to $2,150 zone, which happens to align with the resistance level of this ascending triangle.
Thus, it’s interesting that the ETH TD Sequential setup phase has finished just as the coin has encountered this line that it has been rejected from in the past.
“A pullback from this resistance level could lead to a dip toward the triangle’s hypotenuse at $1,700, setting the stage for a potential uptrend continuation,” explains Ali.
The analyst also notes, however, that the $2,150 level could be one to keep an eye on as if the asset can see a 3-day candlestick close above this level in the coming days, the bearish outlook could be nullified.
ETH PriceEthereum had risen above $2,100 recently, but the coin has seen some pullback in the past day, a potential sign that the sell signal may already be in effect.
Why this matters
This ethereum story adds another data point to the current market tape and is useful when read alongside nearby source coverage.
Original source
Read on NewsBTCRelated market context

Elon Musk Grok AI Predicts a Bold Move for Ethereum in 2026
When prompted, the Elon Musk-backed Grok AI predicts a bold move for Ethereum (ETH) over the remainder of 2026. It claims that if...

Bitcoin (BTC) Price Today: BTC Holds Uptrend as $84K FVG Shapes Intraday Setup
The setup comes as on-chain data shows that profit-taking remains relatively contained despite the latest Bitcoin price recovery....
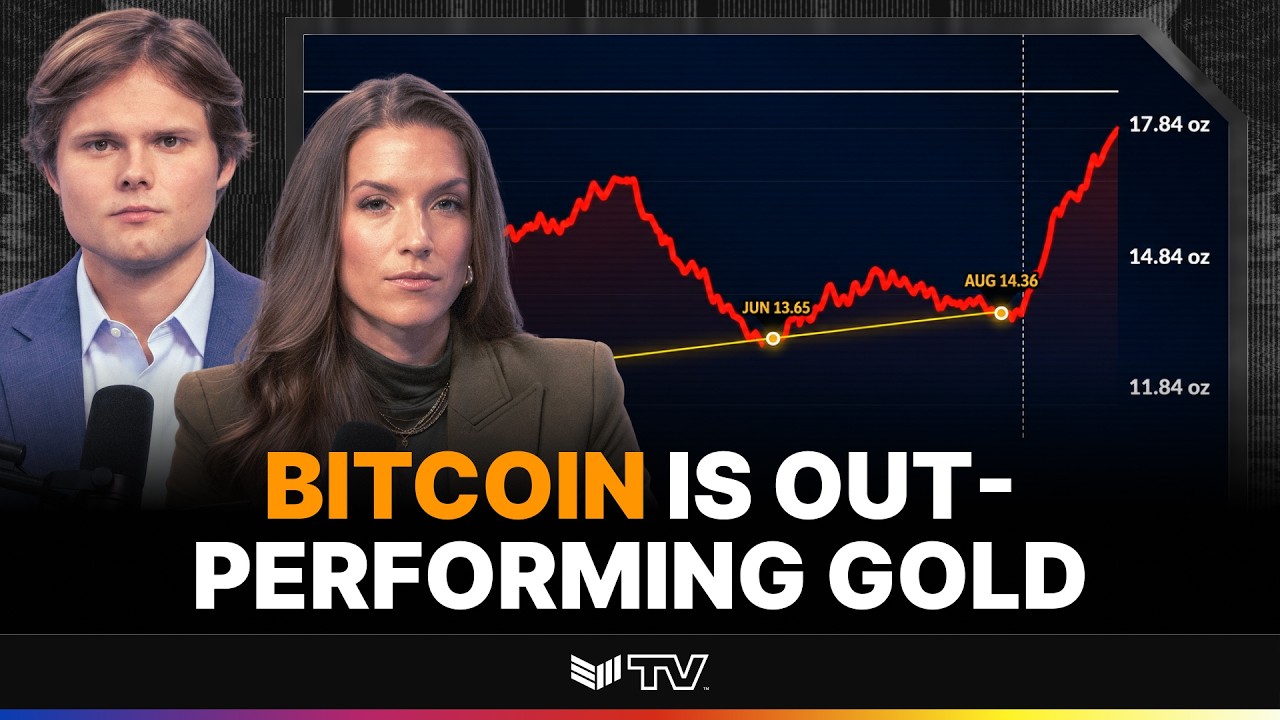
TECHNICAL ANALYSIS: BTC to Cross Key Price Level Against Gold
Bitcoin Magazine TECHNICAL ANALYSIS: BTC to Cross Key Price Level Against Gold The 90-day correlation between Bitcoin and gold jus...

Katie Stockton: $93K BTC is the Key Price Level for the Bull Market
Bitcoin Magazine Katie Stockton: $93K BTC is the Key Price Level for the Bull Market Is the Bitcoin bear market officially over? K...

Bitcoin Price Never Closed Below Expectation in 2026 Bear Market
Bitcoin never posted a daily close below its realized price during the current bear market, and the June 2026 low held above that...

ARK partners with Securitize to put a venture fund on Ethereum, but leaves exit doors locked
ARK Invest and Securitize announced on Sept. 24 that eligible investors would be able to hold tokenized interests in the ARK Ventu...