Ethereum (ETH) Price Prediction: Ethereum’s 1.5-Year Resistance Breakout Could Ignite $7,000 Surge
The breakout marks a major technical milestone and has ignited bullish calls from traders and institutional analysts alike, with some projecting a rally toward $7,000 before year-end. Price Momentum and Market Drivers ET...
Archive context
Older archive item. Useful for background and entity history, but not a fresh market-moving signal.

The breakout marks a major technical milestone and has ignited bullish calls from traders and institutional analysts alike, with some projecting a rally toward $7,000 before year-end.
Price Momentum and Market DriversETH’s latest surge follows a 21% weekly rally, fueled by aggressive institutional accumulation and record-low exchange reserves. According to Lookonchain, a “mysterious institution” purchased 221,166 ETH — worth nearly $1 billion — in just one week. The buying was executed through over-the-counter (OTC) desks and major custodians such as Galaxy Digital, FalconX, and BitGo, with holdings spread across six wallets for security.
Mysterious whale grabs 49,533 ETH today, pushing weekly haul to 221,166 ETH—nearly $1B from top custodians. Source: @lookonchain via X
This wave of buying comes as Ethereum’s market capitalization climbed to $523 billion, surpassing payment giant Mastercard. Publicly traded companies also joined the accumulation spree, with BitMine Immersion Technologies and SharpLink Gaming together adding more than $1.2 billion worth of ETH to their treasuries.
Technical Breakout Targets $7,000 and BeyondAnalyst Cas Abbe described the $4,100 breakout as a “turning point” for Ethereum, noting that ETH has closed green in six of the past seven weeks. “A red candle won’t change anything — I expect a retest of the breakout level, followed by renewed institutional buying,” he said, forecasting a move to new all-time highs by the end of August.
ETH breaks 1.5-year resistance with 6 green weeks out of 7, eyeing a $7K target by August. Source: @cas_abbe via X
Chart patterns support this outlook. Ethereum has broken above a multi-year symmetrical triangle, with technical targets ranging from $6,000 to $8,000 based on the formation’s height. Analysts like Crypto Rover and Titan of Crypto believe such long-term breakouts historically precede multi-month rallies, particularly when volume is rising.
Institutional Flows and On-Chain TrendsUnlike previous bull cycles, institutional flows are now the primary driver of ETH demand. Spot Ethereum exchange-traded fund (ETF) inflows have approached the $10 billion mark, even as Bitcoin ETF momentum slows. At the same time, on-chain adoption is accelerating in areas such as asset tokenization, stablecoin settlements, and Layer 2 scaling solutions.
Ethereum’s strong institutional demand and shrinking supply suggest more room to grow. Source: Ali via X
Tom Lee, co-founder of Fundstrat, highlighted the macro investment case: “Ethereum is arguably the biggest macro trade over the next 10–15 years as Wall Street adopts blockchain technology and tokenomics accelerates.”
Exchange reserves for ETH have dropped to near all-time lows of 18.89 million, tightening supply. Binance, however, has seen rising ETH inflows — possibly for liquid staking programs, which now account for more than 8% of the market share.
Wider Market ImplicationsEthereum’s breakout above long-term resistance is sparking a broader crypto rally, with capital rotation patterns echoing past bull cycles. Historically, strong ETH moves have funneled liquidity from Bitcoin into Ethereum and then altcoins, driving gains in DeFi, gaming, and Web3 assets. Over the past week, Solana (SOL), Avalanche (AVAX), and Chainlink (LINK) have surged double digits, while activity on Layer 2s like Arbitrum and Optimism has spiked.
Ethereum (ETH) has been trading at around $4,272, up 1.97% in the last 24 hours at press time. Source: Ethereum Liquid Index (ELX) via Brave New Coin
Some long-term whales and early ICO holders are taking profits, sending ETH to exchanges as prices test multi-year highs. Yet institutional inflows, shrinking exchange reserves, and expanding on-chain adoption indicate demand is outweighing selling pressure — positioning Ethereum to maintain market leadership and potentially fuel wider crypto gains in the coming quarter.
Ethereum Price OutlookWith momentum on its side, Ethereum now faces a critical test: holding the $4,100 breakout level as new liquidity enters the market. If the retest is successful, technical and fundamental factors align for a potential surge toward $7,000 in the coming months — with some long-term projections stretching as high as $20,000 by 2026 based on historical fractals.
Why this matters
This ethereum story adds another data point to the current market tape and is useful when read alongside nearby source coverage.
Original source
Read on Brave New CoinRelated market context

XRP Price Today: XRP Hits $1.60 as Heavy Whale Accumulation Points to a $2 Rally and Beyond
The XRP price reached $1.6060 on September 23 after opening near $1.5808, according to historical market data. The token subsequen...

ETH USD Loses Ground as Ethereum Price Analysis Remains Targeting $3,000 This Week
Ethereum Price Prediction, September 23: Ethereum (ETH) trades at $2,735, down a marginal 0.61% over the past 24 hours, a pause, n...
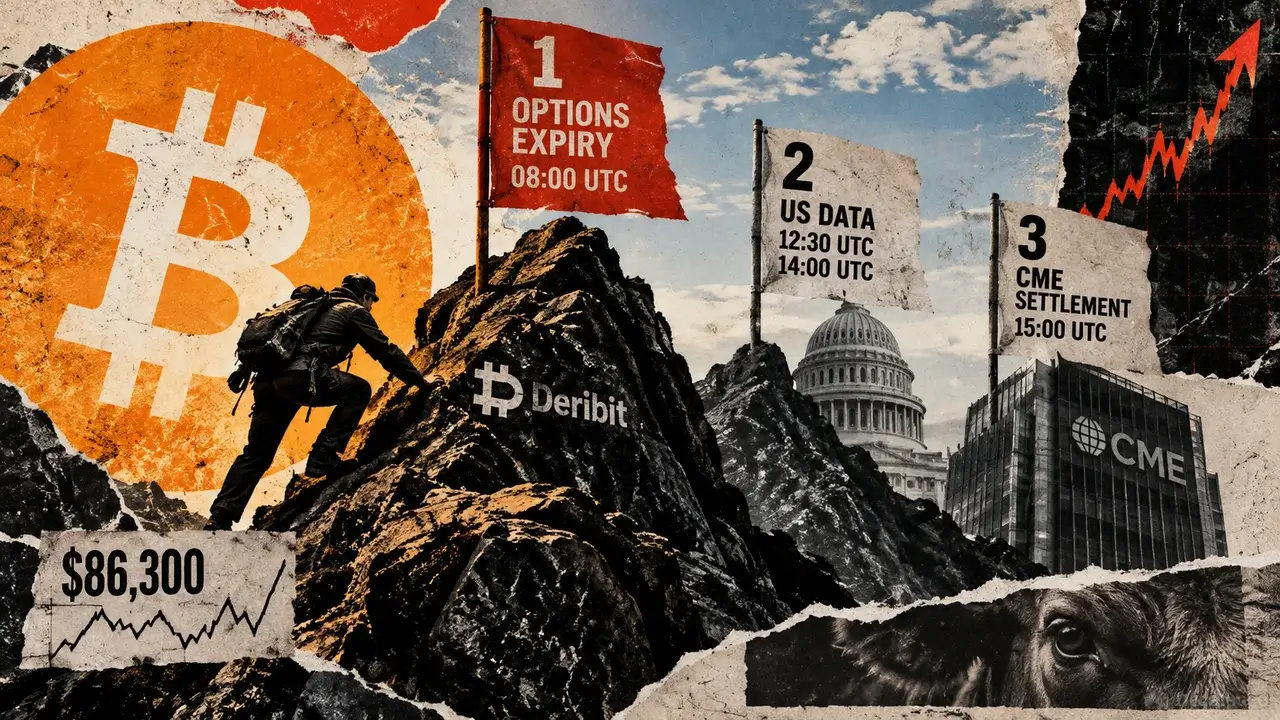
Bitcoin faces $16 billion options expiry Friday, then two more tests hit the rally
Bitcoin options carrying roughly $16 billion in notional value expire on Deribit at 08:00 UTC on Friday, Sept. 25. Calls account f...

Solana Price Prediction: Golden Cross and $2.97B Open Interest Put $400 Target in Focus
Solana price is trading near $117.38 after recovering strongly from its recent lows. With SOL now testing the crucial $118–$120 re...

Bitcoin ETF Inflows Surge Past $1.7 Billion as Average Holder Returns to Profit
U.S. spot Bitcoin ETFs drew $1.7B in two-day net inflows as Bitcoin cleared the $81,722 average cost basis, putting the average ET...

Can Ripple Crack $1.80? XRP Price Prediction Says This Week
XRP Price Prediction: Ripple (XRP) trades at $1.59 as of this writing, up 1.6% on the day, with a 24-hour range spanning $1.5577 t...