Ethereum Evening Star Could Mean Lights Out On Bull Run
Ethereum over the last several weeks finally began to gain some strength against Bitcoin and other top performing cryptocurrencies. But in the past few weeks, the upside has since been almost entirely erased. The up – th...
Archive context
Older archive item. Useful for background and entity history, but not a fresh market-moving signal.

Ethereum over the last several weeks finally began to gain some strength against Bitcoin and other top performing cryptocurrencies. But in the past few weeks, the upside has since been almost entirely erased.
The up – then right back down – price action has formed a potential bearish Japanese candlestick reversal signal. Will ETHUSD continue down further, or surge back into an uptrend? We’ll explore the technical signals to watch for.
Ethereum ETHUSD Possible Reversal SignalThe two top cryptocurrencies by market cap, Bitcoin and Ethereum, have had an unusual divergence between the two assets in terms of price action. While Ethereum bottomed early in 2022, Bitcoin found its bottom later in November of the same year. But in 2023, BTC outperformed ETH by a wide margin.
All this started to change recently as spot BTC ETF news began to cool down, and ETH ETF rumors began to swirl. Post-approval selling of BTC, among other factors, have caused an over 20% correction in Bitcoin and Ether. Price action in ETHUSD, however, has formed what appears to be an evening star candlestick pattern.
In Japanese candlestick analysis, an evening star pattern is a possible bearish reversal pattern, with enough potential to change a bull market to a bear market.
All About The Evening Star PatternAn evening star is a three-candlestick pattern consisting of a tall white candle, a doji, and a large black candle that wipes out at least 50% of the first white candle. The more of the white candle that is engulfed, the stronger the evening star signal can potentially be.
The pattern helps reveal the underlying market sentiment. The large white candle shows increased enthusiasm and strength by bulls, which is met with resistance and confusion. Selling eventually kicks in, as bears regain control and show surprise strength against bulls.
With any Japanese candlestick pattern, context is important. The reversal signal appearing at the top of a rally and with bearish technical indicators firing gives it more possible significance. The same signal appeared at the peak of the 2021 bull market, kicking off an 82% drawdown.
The candlestick pattern is only confirmed after a weekly close. It also requires follow through by bears, pushing ETHUSD to new 2024 lows. If bulls can make a stand and take back 50% or more of the candle, this signal could be invalidated.
Why this matters
This ethereum story adds another data point to the current market tape and is useful when read alongside nearby source coverage.
Original source
Read on NewsBTCRelated market context

Ethereum (ETH) Price Prediction: Bulls and Bears Face Off as $3,000 Rally Meets Liquidation Risk
Ethereum price is entering a volatile phase after its latest recovery, with buyers trying to defend the recent breakout while sell...

Ethereum Price Prediction: ETH Finally Breaks the Bear Pattern
Ethereum price trades at $2,675 after clearing a bull-flag structure that had capped its bullish prediction for weeks. The breakou...
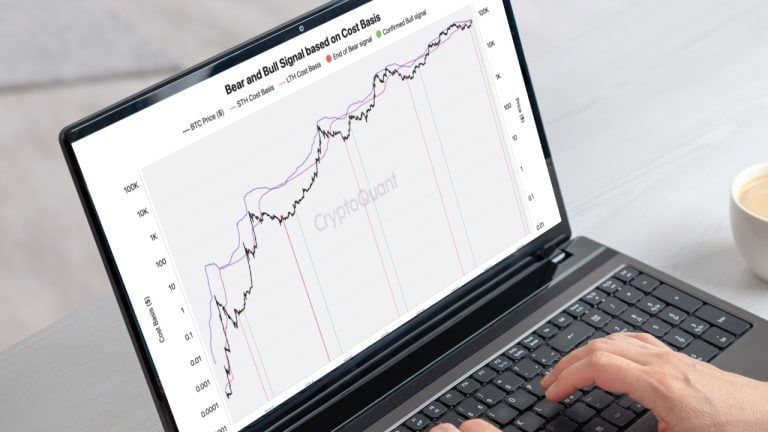
‘Bull Market Confirmed’: Analyst Flags Bitcoin’s Fifth Historic Signal
Bitcoin has produced a fifth historical signal that a new analysis interprets as confirmation of a bull market. The reading follow...

Katie Stockton: $93K BTC is the Key Price Level for the Bull Market
Bitcoin Magazine Katie Stockton: $93K BTC is the Key Price Level for the Bull Market Is the Bitcoin bear market officially over? K...

Elon Musk Grok AI Predicts a Bold Move for Ethereum in 2026
When prompted, the Elon Musk-backed Grok AI predicts a bold move for Ethereum (ETH) over the remainder of 2026. It claims that if...

Bitcoin Price Never Closed Below Expectation in 2026 Bear Market
Bitcoin never posted a daily close below its realized price during the current bear market, and the June 2026 low held above that...